SAT Math : Venn Diagrams
Study concepts, example questions & explanations for SAT Math


All SAT Math Resources
Example Questions
Example Question #11 : Union
Forty students play soccer and/or basketball after school. Twenty-four students play soccer and twenty-nine play basketball. How many students play both soccer and basketball?


We can draw a Venn diagram of these students.
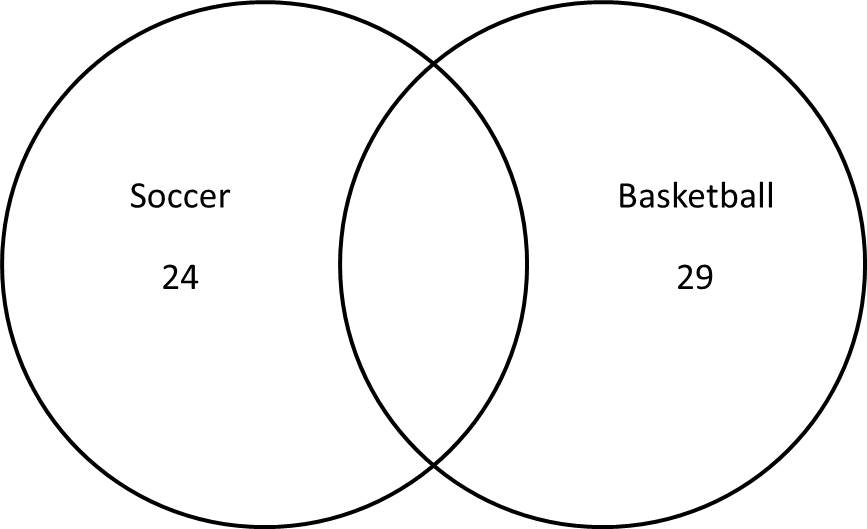
Drawn this way, there are more students on the Venn diagram than we have.

This is because some of the students play both sports and should be in the overlap on the Venn diagram. To find the number of students in the overlap, subtract the total number of students given from the number on the diagram.

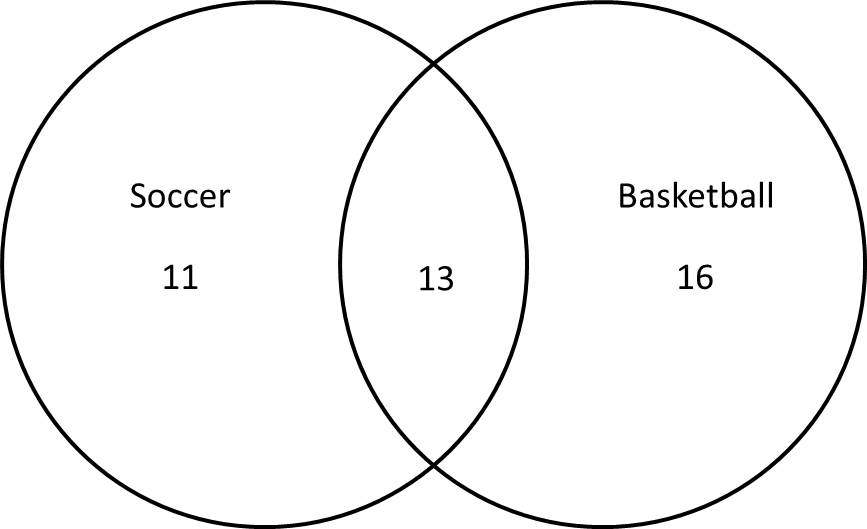
This represents the number of students who were counted twice, or the number in the overlap.
We can redraw the correct Venn diagram with this number.
Example Question #11 : How To Find The Union Of A Venn Diagram
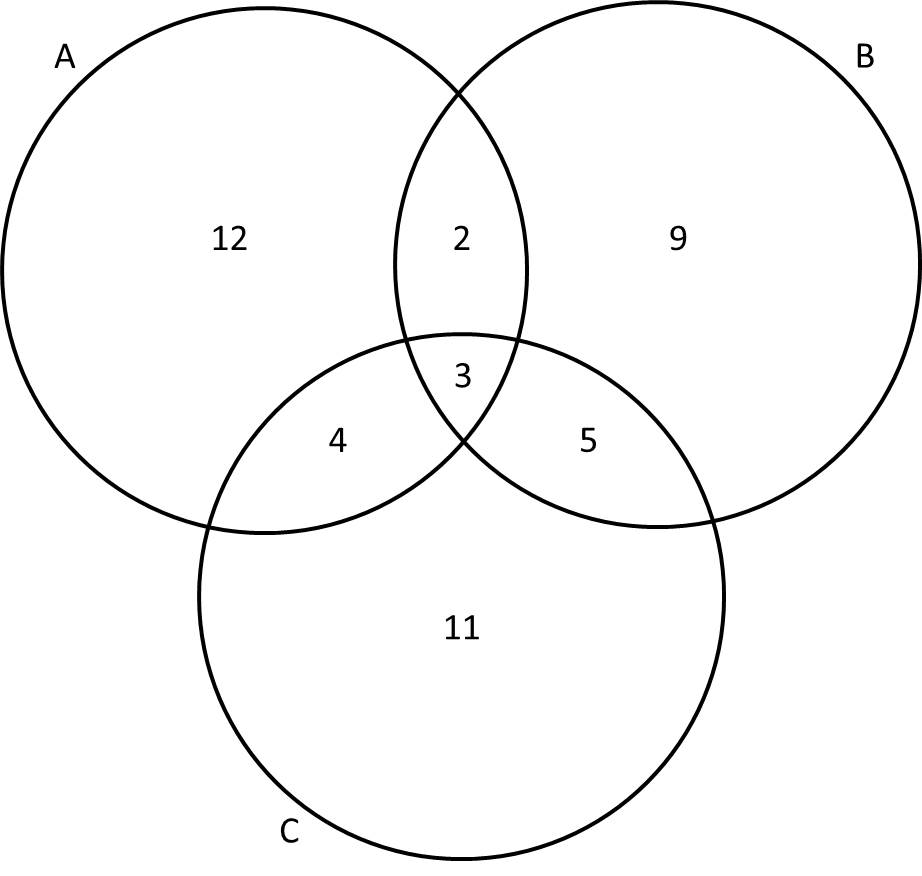
Giving the Venn diagram above, what is the sum of the numbers in the set ?


The notation stands for "A union C," which refers to everything that is in either set or set .


When we add the numbers together, we get:

Example Question #2 : Union
In a class of senior high-school students, have pet cats, have pet dogs, have both cats and dogs, and have neither cats nor dogs. How many total students are in the class?


A Venn diagram can help us determine the total number of students in the class.
First, we must calculate the number of students who have ONLY cats or ONLY dogs. First, for cats, 15 students have cats, and 5 students have both cats and dogs.

Ten students have only cats.
For dogs, 12 students have dogs, and 5 students have both cats and dogs.

Seven students have only dogs.
Using this information, we can fill in the Venn diagram.
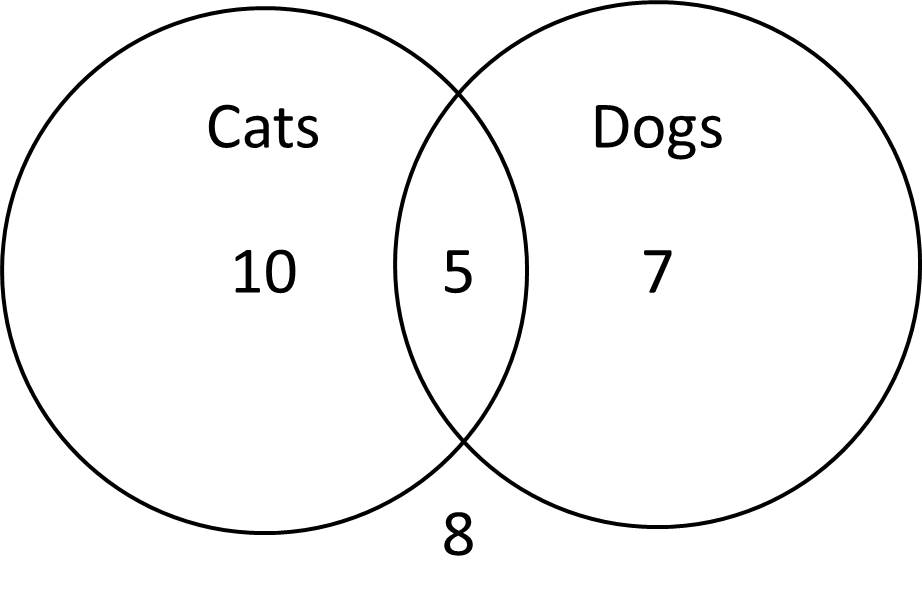
This diagram shows the 10 students with only cats, the 7 students with only dogs, the 5 students with both, and the 8 students with neither. Adding up the numbers will give us the total number of students.

Example Question #11 : Data Analysis
Let Set A = and Set B = .


What is ?


None of the other answers.


represents the union of the two sets. The union of Sets A and B is the set of elements which appear in A, in B, or in both A and B.

Therefore,

Example Question #1 : Intersection
100 students are in the 10th grade class. 30 are swimmers, 40 are runners, and 20 are swimmers and runners. What is the probability that a student is a swimmer OR a runner?
2/3
1/4
1/3
1/5
1/2
1/2
The formula for intersection is P(a or b) = P(a) + P(b) – P(a and b).
Now, 30 students out of 100 swim, so P(swim) = 30/100 = 3/10.
40 students run out of 100, so P(run) = 40/100 = 4/10. Notice how we are keeping 10 as the common denominator even though we could simplify this further. Keeping all of the fractions similar will make the addition and subtraction easier later on.
Finally, 20 students swim AND run, so P(swim AND run) = 20/100 = 2/10. (Again, we keep this as 2/10 instead of 1/5 so that we can combine the three fractions more easily.)
P(swim OR run) = P(swim) + P(run) – P(swim and run)
= 3/10 + 4/10 – 2/10 = 5/10 = 1/2.
Example Question #2 : Intersection
and .


Find .


The intersection of two sets contains every element that is present in both sets, so is the correct answer.

Example Question #1 : How To Find The Intersection Of A Venn Diagram
We have two sports clubs offered to a class of 100 students. 70 students joined the basketball club, 40 students joined the swimming club, and 10 students joined neither. How many students joined both the swimming club and the basketball club?


The idea is to draw a Venn Diagram and find the intersection. We have one circle of 70 and another with 40. When we add the two circles plus the 10 students who joined neither, we should get 100 students. However, when adding the two circles, we are adding the intersections twice, therefore we need to subtract the intersection once.
We get , which means the intersection is 20.

Example Question #1 : Intersection
High school freshmen can take Biology, Chemistry, or both. If freshmen take Biology, freshmen take Chemistry, and there are freshmen in total. How many freshmen take both Biology and Chemistry?


If students are enrolled in sciences, but there are only students then we must find how many overlap in the subjects they take.


To do this we can subtract from .


Therefore, of those "enrollments" must be doubles.

Those students take both Chemistry and Biology.

Example Question #2 : How To Find The Intersection Of A Venn Diagram
Fifty 6th graders were asked what their favorite school subjects were. Three students like math, science and English. Five students liked math and science. Seven students liked math and English. Eight people liked science and English. Twenty students liked science. Twenty-eight students liked English. Fourteen students liked math. How many students didn’t like any of these classes?
None of the answers are correct
5
10
7
3
5
Draw a Venn diagram with three subsets: Math, Science, and English. Start in the center with students that like all three subjects. Next, look at students that liked two subjects. Be sure to subtract out the ones already counted in the middle. Then, look at the students that only like one subject. Be sure to subtract out the students already accounted for. Once all of the subsets are filled, look at those students who don’t like any of these subjects. To find the students who don’t like any of these subjects add all of the students who like at least one subject from the total number of students surveyed, which is 50.
M = math
S = science
E = English
M∩S∩E = 3
M∩S = 5 (but 3 are already accounted for) so 2 for M and S ONLY
M∩E = 7 (but 3 are already accounted for) so 4 for M and E ONLY
S∩E = 8 (but 3 are already accounted for) so 5 for S and E ONLY
M = 14 (but 3 + 2 + 4 are already accounted for) so 5 for M ONLY
S = 20 (but 3 + 2 + 5 are already accounted for) so 10 for S ONLY
E = 28 (but 3 + 4 + 5 are already accounted for) so 16 for E ONLY
Therefore, the students already accounted for is 3 + 2 +4 + 5 + 5 + 10 + 16 = 45 students
So, those students who don’t like any of these subjects are 50 – 45 = 5 students
Example Question #3 : How To Find The Intersection Of A Venn Diagram
Set A contains the positive even integers less than 14. Set B contains the positive multiples of three less than 20. What is the intersection of the two sets?
A∩B = {6, 12, 18}
A∩B = {6}
A∩B = {6, 12}
A∩B = { }
A∩B = {4, 6, 8}
A∩B = {6, 12}
A = {2, 4, 6, 8, 10, 12}
B = {3, 6, 9, 12, 15, 18}
The intersection of a set means that the elements are in both sets: A∩B = {6, 12}


Certified Tutor

All SAT Math Resources

