SAT II Math II : Quartiles and Interquartile Range
Study concepts, example questions & explanations for SAT II Math II


All SAT II Math II Resources
Example Questions
Example Question #1 : Quartiles And Interquartile Range
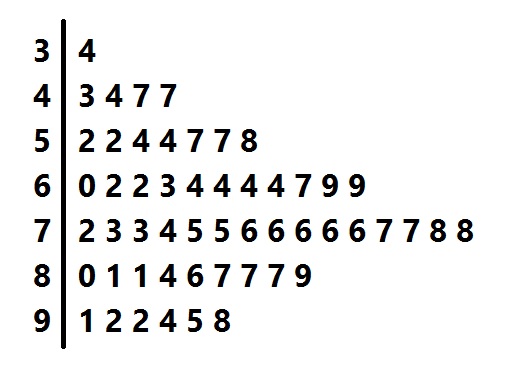
Above is the stem-and-leaf display for a group of test scores. Give the interquartile range of the scores represented.


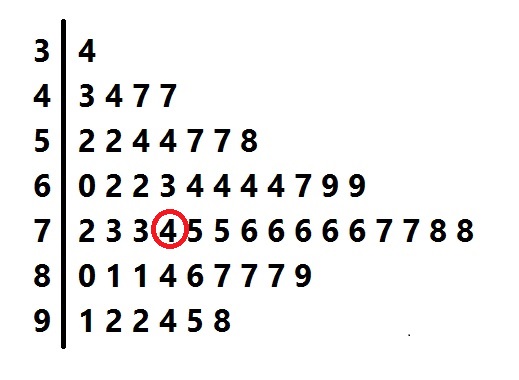
The interquartile range is the difference between the third and first quartiles. To find these quartiles, first find the median of the scores. There are 53 scores represented, so look for the score in position

As can be seen in this diagram, the score is 74.
The first quartile is the median of the lower half of the scores - that is, the lower 26 scores. Since 26 is even, the median is the mean of the scores in positions 

As can be seen in this diagram, these scores are 60 and 62.
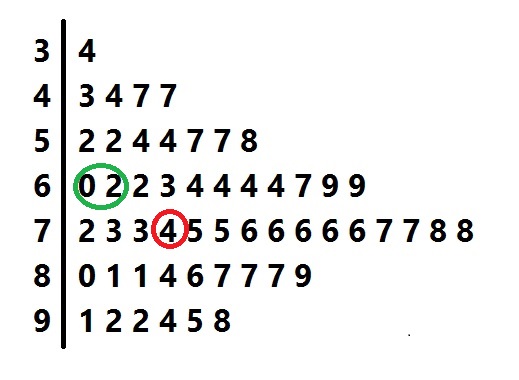
The first quartile of the scores is therefore

The third quartile, similarly, can be found by finding the mean of the 13th and 14th elements in the top half of the scores:
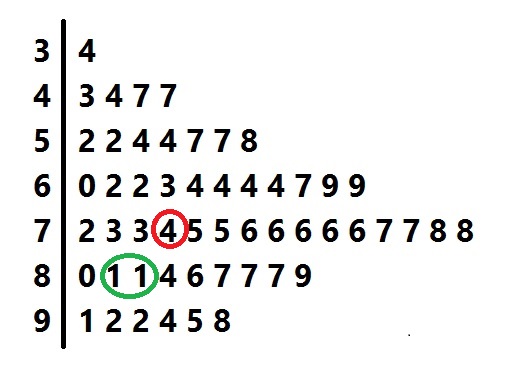
As can be seen in this diagram, these scores are 81 and 81, so the third quartile is 81.
The interquartile range is the difference:

Example Question #1 : Quartiles And Interquartile Range
Above is the stem-and-leaf display for a group of test scores. What score is at the third quartile?


To find the third quartile, first find the median of the scores. There are 53 scores represented, so look for the score in position

As can be seen in this diagram, the score is 74.
The third quartile is the median of the upper half of the scores - that is, the higher 26 scores. Since 26 is even, the median is the mean of the scores in positions 

As can be seen in this diagram, both of these scores are 81, so the third quartile is 81.
Example Question #492 : Sat Subject Test In Math Ii
Above is the stem-and-leaf display for a group of test scores. What is the first quartile?


To find the first quartile, first find the median of the scores. There are 53 scores represented, so, 53 being odd, look for the score in the center. This is the score in position

As can be seen in this diagram, the score is 74.
The first quartile is the median of the lower half of the scores - that is, the lower 26 scores. Since 26 is even, the median is the mean of the scores in positions 

As can be seen in this diagram, these scores are 60 and 62.
The first quartile of the scores is therefore 
Example Question #494 : Sat Subject Test In Math Ii
Consider the following numbers: 


The first quartile is Q1.
Reorganize the numbers in chronological order.

The Q1 is the median of 
The answer is:


Certified Tutor

All SAT II Math II Resources

