Precalculus : Solve and Graph Rational Inequalities
Study concepts, example questions & explanations for Precalculus


All Precalculus Resources
Example Questions
Example Question #2 : Solving Polynomial And Rational Inequalities
Solve the inequality.


")
\cup [2,\infty)")
")
\cup \left[\frac{1}{3},2\right]")
First, subtract 

Then find the common denominator and simplify
}{x+1}\leq0\rightarrow\frac{3x^2-7x+2}{x+1}\leq0")
Next, factor out the numerator
(x-2)}{x+1}\leq0")
and set each of the three factor equal to zero and solve for 
The solutions are

Now plug in values between ")


")
Note that 
")

Thus, the solution to the inequality is
\cup \left[\frac{1}{3},2\right]")
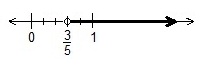
Example Question #3 : Solving Polynomial And Rational Inequalities
Solve and graph:


1) Multiply both sides of the equation by the common denominator of the fractions:
(\frac{4x + 3}{4} - \frac{2x}{x + 1}) < x\cdot4(x + 1)")
(x + 1) < 4x(x + 1)")
2) Simplify:


3) For standard notation, and the fact that inequalities can be read backwards:

For interval notation:
")
4) Graph:
Example Question #4 : Solving Polynomial And Rational Inequalities
Solve and graph:
")
 \cap (5, +\infty )")


Graph the rational expression,
1) Because 


2) As 


3) As 


4) The funtion y is exists over the allowed x-intervals:
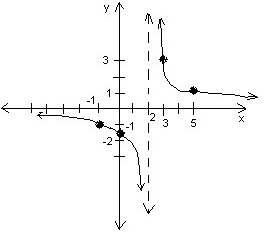
One approach for solving the inequality:
For
1) Determine where 


2) 
")
")
3) Then the solution is  \cup (5, +\infty )")
Another approach for solving the inequality:
1) Write 


2) 


3) Then the solution is
Example Question #5 : Solving Polynomial And Rational Inequalities
Which of the following best describes the statement:
The undefined points of rational functions are vertical asymptotes.
The statement is always false
The statement is true in some cases and false in others
The statement is always true
The statement is always true
When solving for a point where the function will be undefined, you set the denominator equal to zero and solve for . This creates a vertical asymptote because when the denominator equals zero the function is undefined and we are solving for
. Say for example a function is undefined at
. So at all values of
where
this function is undefined creating a vertical asymptote.
Example Question #1 : Solve And Graph Rational Inequalities
Which of the following is a graph of the function:


We begin by finding the zeros of the equation using the numerator.

(x+5)=0")

So we know that the function will equal zero when 


And so the function is undefined at 
|
x |
y |
|
|
|
|
|
|
|
|
|
|
|
|
|
|
|
|
|
|
|
|
|
|
|
|
|
|
|
|
|
|


And if we graph these points we see something like below (which is our answer). Note that the dotted blue line is the vertical asymptote at 
Example Question #2 : Solve And Graph Rational Inequalities
Determine the zeros of the following function and the points where the function will be undefined.

zeros: 

zeros: 

zeros: 

zero: 

zero:
The zeros of the function are the values of 

(x-2)=0")
We only need to solve for 


So the zeros of this function are 
To solve for the points at which this function will be undefined, we set the denominator equal to zero and solve for 


And so the function is undefined at

Example Question #1 : Solving Polynomial And Rational Inequalities
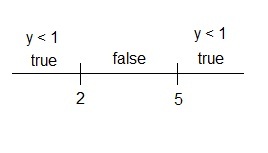
True or False: For the inequality 


True
False
False
This inequality wants all values where 


Example Question #9 : Solving Polynomial And Rational Inequalities
Which of the following is an accurate graph of the inequality 


We will first begin by solving for the zeros and undefined points of the inequality. We solve for the zeros by setting the numerator equal to zero.

\left ( x-1 \right )=0")

And so the zeros of this function are at

Now we will solve for the undefined points by setting the denominator equal to zero. Since the denominator is 


For 


Certified Tutor


All Precalculus Resources

