ISEE Upper Level Quantitative : Tables
Study concepts, example questions & explanations for ISEE Upper Level Quantitative


All ISEE Upper Level Quantitative Resources
Example Questions
Example Question #21 : Tables
Two standard decks of cards are altered as follows: the jacks from Deck 1 are switched with the aces from Deck 2.
Which is the greater quantity?
(a) The probability that a card randomly drawn from Deck 1 is black
(b) The probability that a card randomly drawn from Deck 2 is black
It is impossible to tell from the information given
(a) is greater
(a) and (b) are equal
(b) is greater
(a) and (b) are equal
Two black cards and two red cards from Deck 1 are being switched with two black cards and two red cards from Deck 2, so even after the switch, in each deck, half the cards are black and half are red. Therefore, the probability of drawing a black card from Deck 1 remains 
Example Question #22 : Tables
Two standard decks of cards are altered as follows: two jacks from Deck 1 are switched with two deuces from Deck 2.
Which is the greater quantity?
(a) The probability that a card randomly drawn from Deck 1 is black
(b) The probability that a card randomly drawn from Deck 2 is black
(a) is greater
(a) and (b) are equal
(b) is greater
It is impossible to tell from the information given
It is impossible to tell from the information given
The colors of the cards are not given, so it is now impossible to determine which deck has more black cards than red cards, if either does. For example, if the jacks are black and the deuces are red, Deck 1 now has more red cards and Deck 2 has more black cards; if the reverse holds true of the jacks and the deuces, the reverse holds true of the makeup of the decks.
Therefore, it is unknown whether you are more likely to draw a black card from Deck 1 or Deck 2.
Example Question #23 : Tables
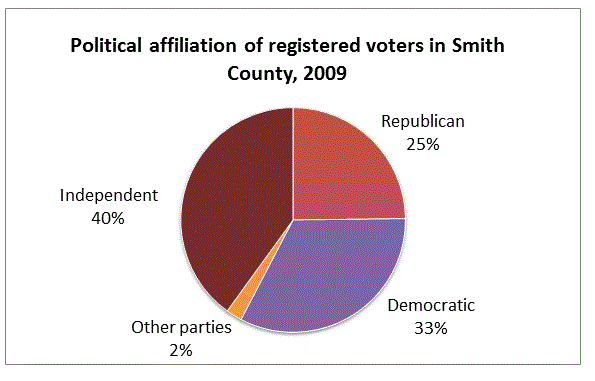
Refer to the above diagram. You are given that there are 
(a) The number of registered Republicans in Smith County
(b)

It is impossible to tell from the information given.
(b) is greater.
(a) and (b) are equal.
(a) is greater.
(b) is greater.
Let 


Solve for 


There are fewer than 
Example Question #524 : Isee Upper Level (Grades 9 12) Quantitative Reasoning
Below is a table that gives the population of Washington City for five census years.

It is known that 12% of the residents of Washington City were Black in 1970, and that 22% of the residents of Washington City were Black in 2010.
Which is the greater quantity?
(a) The number of residents of Washington City who were not Black in 1970
(b) The number of residents of Washington City who were not Black in 2010
It cannot be determined from the information given
(a) and (b) are equal
(b) is greater
(a) is greater
(b) is greater
(a) 12% of the 3,872 residents of Washington City were Black in 1970. Therefore, 88% of the residents were not Black; this makes

(b) 22% of the 4,832 residents of Washington City were Black in 2010. Therefore, 78% of the residents were not Black; this makes

(b) is greater.
Example Question #24 : Tables
A standard deck of cards is altered by removing two jacks. A card is drawn at random from this altered deck. Which is the greater quantity?
(a) The probability of drawing a red card
(b) The probability of drawing a black card
(b) is greater
(a) is greater
It is impossible to tell from the information given
(a) and (b) are greater
It is impossible to tell from the information given
The colors of the jacks removed are not given, so it is not known whether there are more black cards or red cards now.
Example Question #25 : Tables
Two standard decks of cards are altered as follows: ten cards from Deck 1 are switched with ten cards from Deck 2.
Which is the greater quantity?
(a) The probability that a card randomly drawn from Deck 1 is black
(b) The probability that a card randomly drawn from Deck 2 is red
(b) is greater
(a) and (b) are equal
(a) is greater
It is impossible to tell from the information given
(a) and (b) are equal
Since each deck will still have 52 cards, the number of red cards in Deck 1 will be equal to the number of black cards in Deck 2, and vice versa. Therefore, the two probabilities are the same.
Example Question #26 : Tables
Below is a table that gives the population of Washington City for five census years.
Which is the greater quantity?
(a) The population increase in Washington City from 1970 to 1980
(b) The population increase in Washington City from 1980 to 1990
It is impossible to tell from the information given
(b) is greater
(a) is greater
(a) and (b) are equal
(a) is greater
(a) Between 1970 and 1980, the population increase was

(b) Between 1980 and 1990, the population increase was

(a) is greater
Example Question #27 : Tables
Below is a table that gives the population of Washington City for five census years.
Which is the greater quantity?
(a) The mean increase in population per year from 1970 to 2010
(b) The mean increase in population per year from 1970 to 1980
It cannot be determined from the information given.
(a) and (b) are equal.
(a) is greater.
(b) is greater.
(b) is greater.
(a) The mean increase in population per year from 1970 to 2010 is the difference in the populations divided by 40:

(b) The mean increase in population per year from 1970 to 1980 is the difference in the populations divided by 10:

(b) is greater.
Example Question #28 : Tables
Below is a table that gives the population of Washington City for five census years.

Which is the greater quantity?
(a) The increase in the population of Washington City from 1980 to 1990
(b) The decline in the population of Washington City from 1990 to 2000
(b) is greater.
It is impossible to tell from the information given.
(a) is greater.
(a) and (b) are equal.
(a) is greater.
The population of Washington City was greater in 2000 than it was in 1980, so the decline over the second decade must have been less than the increase over the first.
Example Question #29 : Tables
John and James each have a standard deck of 52 cards. Each draws a card at random from his deck; John shows James a nine. Which is the greater quantity?
(a) The probability that James has a card higher in rank, aces being highest.
(b)

It is impossible to tell from the information given.
(a) and (b) are equal.
(b) is greater.
(a) is greater.
(a) is greater.
To have a card higher in rank than John's nine, James must have a ten, a jack, a queen, a king, or an ace. This makes five ranks out of thirteen, each of which can be drawn with equal probability. James has a 


All ISEE Upper Level Quantitative Resources

