High School Math : Basic Statistics
Study concepts, example questions & explanations for High School Math


All High School Math Resources
Example Questions
Example Question #1 : Using Scatter Plots
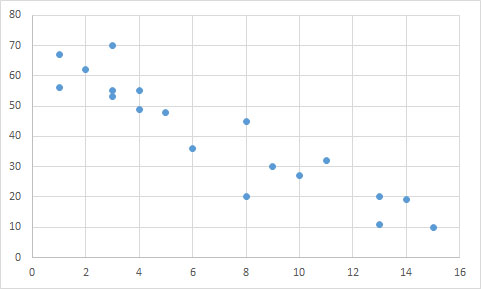
Based on the scatter plot below, is there a correlation between the 

No; there is no correlation
Yes; negative exponential relationship
Yes; positive linear relationship
Yes; negative linear relationship
Yes; negative linear relationship
The data points follow an overall linear trend, as opposed to being randomly distributed. Though there are a few outliers, there is a general relationship between the two variables.
A line could accurately predict the trend of the data points, suggesting there is a linear correlation. Since the y-values decrease as the x-values increase, the correlation must be negative. We can see that a line connecting the upper-most and lower-most points would have a negative slope.
An exponential relationship would be curved, rather than straight.
Example Question #1 : Data Properties
Six homes are for sale and have the following dollar values in thousands of dollars:
535
155
305
720
315
214
What is the range of the values of the six homes?


The range is the simplest measurement of the difference between values in a data set. To find the range, one simply subtracts the lowest value from the greatest value, ignoring the others. Here, the lowest value is 155 and the greatest is 720.

Example Question #1 : Understanding Range
Alice recorded the outside temperature at noon each day for one week. These were the results.
Monday: 78
Tuesday: 85
Wednesday: 82
Thursday: 84
Friday: 82
Saturday: 79
Sunday: 80
What is the range of temperatures?


The range is the simplest measurement of the difference between values in a data set. To find the range, simply subtract the lowest value from the greatest value, ignoring the others.

Example Question #2 : Understanding Range
You are given the following data:

What is the range?


Recall that we find the range of a set of data by subtracting the smallest value from the largest value. In this case, the smallest value is 


Example Question #12 : Basic Statistics
There are 


Probability is a fraction between 

The number of ways only boys would finsih in the top three places:

The number of ways all contestants can finish the race:

So the probability of only boys finishing in the top three places is given by the fraction 
Example Question #1 : Understanding Mean, Median, And Mode


mode
median
range
mean
median
Reorder the numerals in the set, from least to greatest.

The number in the middle is the median.

The most frequent numeral is the mode.

The mean is the sum of the numerals divided by the number of data points.

The mean is 15.
The range is the difference between the maximum and the minimum.

The range is 8.
Example Question #1 : Understanding Mean, Median, And Mode
For the following data set:

Which is the smallest?
Range
None of the answers
Median
Mode
Mean
Mean
Put the data in order from smallest to largest and then calculate each stastic: mean, mode, median, range


Mode is the most often repeated number or

Median is the number in the middle or

Mean is the sum of the data divided by the number of data points or

Example Question #12 : Basic Statistics


Example Question #2 : Understanding Mean, Median, And Mode
Find the median of the following number series:
3, 6, 27, 19, 8, 11, 30, 42, 7, 39
19
15
30
19.2
11
15
The first step to finding the median is always to put the numbers in the proper order:
3, 6, 7, 8, 11, 19, 27, 30, 39, 42
When we have an even amount of numbers, we find the average (or mean) of the middle two to get the median:
11 + 19 = 30/2 = 15
Example Question #11 : Basic Statistics
With a standard deck of playing cards, what is the probability of picking one red card followed by one black card, without replacement?


In a standard deck of playing cards we have:

So the probability of picking the first card red is 
Then the probability of picking the second card black is 
They are independent events so the probabilities get multiplied together to give 


All High School Math Resources

