College Algebra : Graphing Polynomials
Study concepts, example questions & explanations for College Algebra


All College Algebra Resources
Example Questions
Example Question #2 : Transformations Of Parabolic Functions
If the function ")
")

None of these graphs are correct.


The function ")

")

To translate along the y-axis, we use the function +k")
-k")
Example Question #1 : Graphing Polynomials
Which of the following graphs correctly represents the quadratic inequality below (solutions to the inequalities are shaded in blue)?
^2")


To begin, we analyze the equation given: the base equation, 
^2")

To solve the inequality, we need to take a test point and plug it in to see if it matches the inequality. The only points that cannot be used are those directly on our parabola, so let's use the origin ")
^2")
Simplified as:

Which is not true, so the area inside of the parabola should be shaded, resulting in the following graph:
Example Question #63 : Polynomial Functions
How many zeroes does the following polynomial have?
 = x^3-3x^2+5x-15")


")


If we try the next number up, 3, we get this:

")
+5(x-3)}{x-3} = x^2+5")
and now we need to see if 

There aren't any real numbers that square to get -5 so this has no roots. Thus, ")
Example Question #64 : Polynomial Functions
")
 = 2")
 = 12")
True or false: By the Intermediate Value Theorem, ")
")
False
True
False
As a polynomial function, the graph of ")
 < M < P(b)")
 < M < P(a)")
")
= M")
Set 

 < 0< P(1)")
")
= 0")

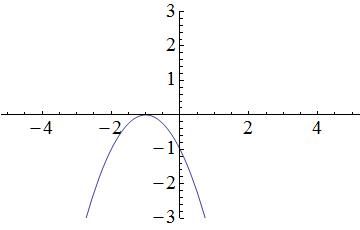
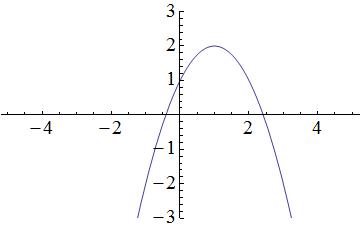
Both are polynomial graphs fitting the given conditions, but the only the equation graphed at right has a zero on ")
Example Question #2 : Graphing Polynomials
True or false:
The polynomial 

True
False
True
One way to answer this question is as follows:
Let  = 7x^{7} + 4x^{6}- 11")
")

 = 7x^{7} + 4x^{6}- 11")

as its coefficient sum, so 

Example Question #5 : Graphing Polynomials
True or false:
The polynomial 

False
True
False
Let  = 7x^{5}+ 9x^{4} - 16")
")

To find this alternating sum, it is necessary to reverse the symbol before all terms of odd degree. In ")


so 

Example Question #2 : Graphing Polynomials
 = 6")
 = -7")
True or false: By the Intermediate Value Theorem,
False
True
True
As a polynomial function, the graph of
Setting 
 < 0 < P(0)")
")
= 0")
")

 < 0 < P(0)")
Example Question #7 : Graphing Polynomials
Let ")

True or false: It follows that 
")
True
False
True
By the Factor Theorem, 
")
 = 0")

")
 = 0")
")

 = p(c)")

 = p(2)")
 = 0")

")
Example Question #11 : Understand Linear And Nonlinear Functions: Ccss.Math.Content.8.F.A.3
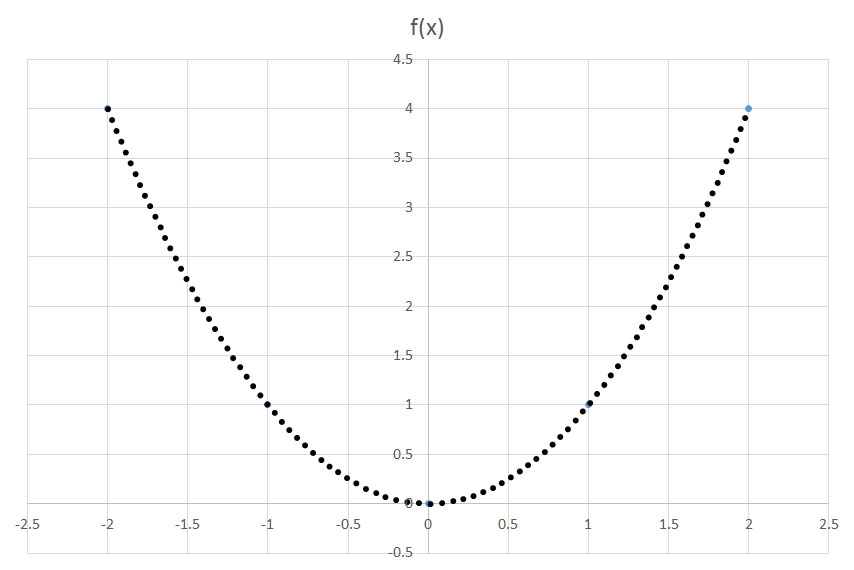
Which of the following graphs matches the function ^2-2")
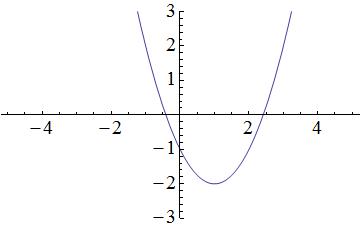
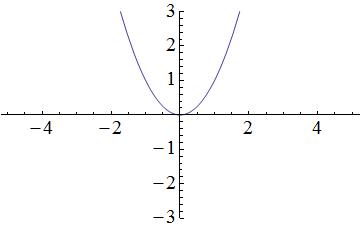
Start by visualizing the graph associated with the function 
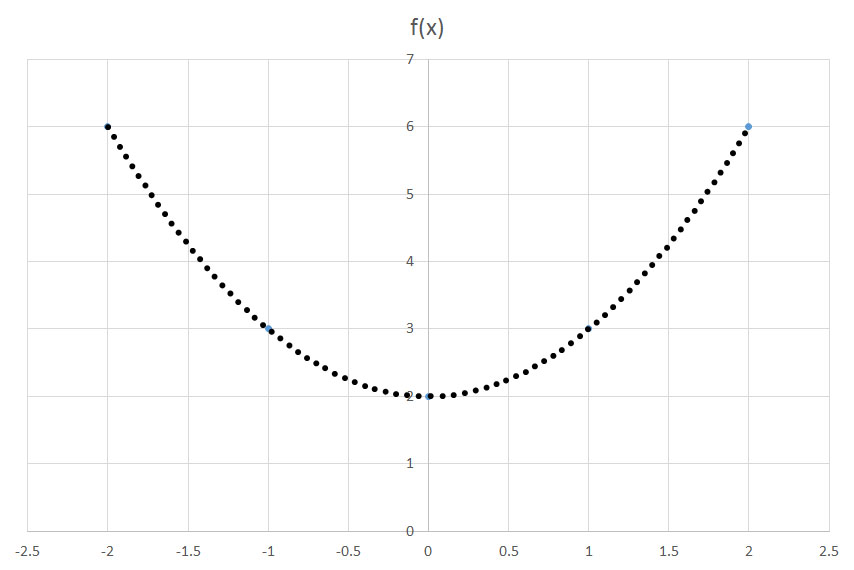
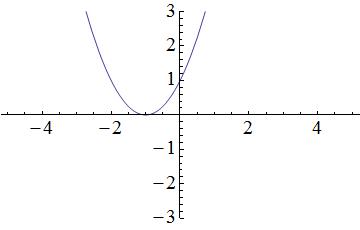
Terms within the parentheses associated with the squared x-variable will shift the parabola horizontally, while terms outside of the parentheses will shift the parabola vertically. In the provided equation, 2 is located outside of the parentheses and is subtracted from the terms located within the parentheses; therefore, the parabola in the graph will shift down by 2 units. A simplified graph of 
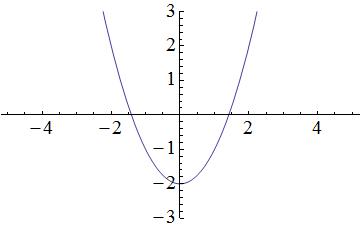
Remember that there is also a term within the parentheses. Within the parentheses, 1 is subtracted from the x-variable; thus, the parabola in the graph will shift to the right by 1 unit. As a result, the following graph matches the given function ^2-2")

Certified Tutor

Certified Tutor

All College Algebra Resources

