Algebra 1 : Graphing Inequalities
Study concepts, example questions & explanations for Algebra 1


All Algebra 1 Resources
Example Questions
Example Question #1 : Graphing Inequalities
Graph the compound inequality:


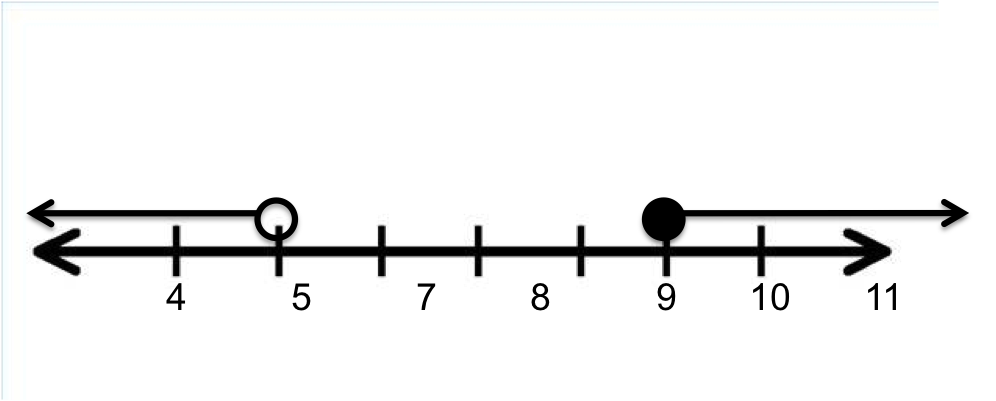
The compund inequality requires a graph in which the values of 

Example Question #2 : Graphing Inequalities
Which of the following graphs depicts the inequality:


First, graph the line of the equation. It is written in slope-intercept from; therefore the slope is 

When an inequality is written as less than or greater than, a dashed line is used. When an inequality is written as less than or equal to, or greater than or equal to, a solid line is used. Therefore, a dashed line should be used, eliminating two of the answer choices.
Next, use a test point to determine which regions should be shaded. A test point can be any point not on the line; the origin is generally a good choice. If the origin, ")

(0)-4")

This statement is TRUE; the section containing the origin should be shaded.
Example Question #2 : Solving Inequalities
Solve the compound inequality and express answer in interval notation:


 \cup \left (2, \infty \right )")
")

")
For a compound inequality, we solve each inequality individually. Thus, for the first inequality, 


")
")
 \cup \left (2, \infty \right )")
Example Question #3 : Graphing Inequalities

Which inequality describes the graph?


First, we find the equation of the boundary line using the two intercepts. The slope is

The 

The slope-intercept form of the equation is therefore

Put this in standard form:


=2 \cdot 3")

The inequality is therefore either 

")

This inequality holds, so the answer is 
Example Question #2 : Graphing Linear Functions

Refer to the above diagram. which of the following compound inequality statements has this set of points as its graph?


A horizontal line has equation 


A vertical line has equation 


Since only the region belonging to both sets is shaded - that is, their intersection is shaded - the statements are connected with "and". The correct choice is 
Example Question #32 : Linear Functions

Which of the following inequalities is graphed above?


First, we determine the equation of the boundary line. This line includes points ")
")

Since we also know the 
")


The boundary is included, as is indicated by the line being solid, so the equality symbol is replaced by either 

")


0 is less than 3 so the correct symbol is 
The inequality is 
Example Question #5 : Graphing Inequalities

Which of the following inequalities is graphed above?


First, we determine the equation of the boundary line. This line includes points ")
")
} = \frac{7}{2}")
Since we also know the 
")


The boundary is included, as is indicated by the line being solid, so the equality symbol is replaced by either 

")


0 is less than 7 so the correct symbol is 
The correct choice is 
Example Question #33 : Linear Functions

Which of the following inequalities is graphed above?


First, we determine the equation of the boundary line. This line includes points ")
")

Since we also know the 
")


The boundary is excluded, as is indicated by the line being dashed, so the equality symbol is replaced by either 

")


1 is greater than 0 so the correct symbol is

The inequality is

Example Question #65 : Linear Inequalities

The above graph depicts which of the following equations or inequalities?


Given the above graph, we can initially deduce that 


We can use a test point to determine which of the remaining inequalities is the correct answer. The test point can be any point that is not on the line, so let's select ")
")


")

Example Question #71 : Linear Inequalities

The above graph depicts which of the following equations or inequalities?


Given the above graph, we can initially deduce that 


We can use a test point to determine which of the remaining inequalities is the correct answer. The test point can be any point that is not on the line, so let's select ")
")


")


All Algebra 1 Resources

