ACT Science : How to find experimental design in physics
Study concepts, example questions & explanations for ACT Science


All ACT Science Resources
Example Questions
Example Question #51 : Physics
Sometimes scientists need to scale down experiments because collecting full-scale data may not be practical or possible. Most of the time, the data collected during a small scale-experiment is an accurate indicator of full-scale results. For example, research of craters on the Earth’s surface has indicated that the Earth has experienced a history of massive meteor collisions. It has been hypothesized that, amongst other things, these impacting meteorites caused the Earth’s oceans to vaporize. The detrimental effects associated with meteor collisions would have made the planet to be uninhabitable to humans. Due to these adverse effects, an experiment that could produce meteor-sized craters would not be possible in a full-scale setting.
Researchers have developed small-scale experiments that are exemplary of Newton’s three laws of motion. Newton’s first law states that an object in motion will stay in motion unless it is acted on by another force. This phenomenon is known as inertia. The second law comes in the form of an equation that calculates how much force is exerted on two colliding objects with respect to mass and acceleration. In other words force is equal to the mass of an object multiplied by its acceleration. The third law states that for every action there is an equal and opposite reaction. In other words, forces always occur in pairs. A counter force that is equal in magnitude and opposite in direction compliments each force in a particular direction. For example, if you push downwards on a table then the table, in theory, pushes upwards with the same force.
In a particular small-scale exercise, students were asked to design an experiment in which two “meteorites” would be dropped into a medium of sand and the subsequent crater diameters would be measured. Afterwards, the sand would be leveled and the experiment would be repeated. The students were asked to identify all of the factors that could affect the formation of the craters. This was done in order to ensure that each experiment was testing one independent and one dependent variable at a time. Otherwise, it would be unclear which variable is causing the observed effect. Possible variables that could alter the outcome of the experiment included but were not limited to the following: height of the fall, speed of the “meteorite,” angle of impact, and the mass of meteorite.
Consider an experiment that seeks to identify the mass of the meteorite analog. All other variables would have to remain constant in order to ensure accurate results. In order to do this, the height of the fall was set to one meter. The object was placed on top of a vertical meter stick. In order to keep the acceleration and height of the drop constant, it was rolled off of the stick instead of being pushed or simply dropped. Last, a protractor was used to keep the meter stick at a ninety-degree angle. In the procedure, a marble and a golf ball were used as “meteorites” of different masses.
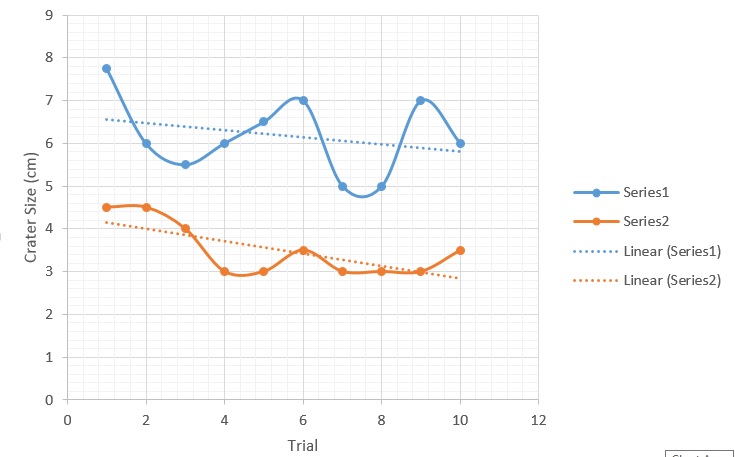
The results of the experiment were recorded in the table and figure provided.
| Crater Diameter (cm) | ||
| Trial Number | ||
| Marble (mass = 4g) | Golf ball (mass = 46g) | |
| 1 | 4.5 | 7.75 |
| 2 | 4.5 | 6 |
| 3 | 4 | 5.5 |
| 4 | 3 | 6 |
| 5 | 3 | 6.5 |
| 6 | 3.5 | 7 |
| 7 | 3 | 5 |
| 8 | 3 | 5 |
| 9 | 3 | 7 |
| 10 | 3.5 | 6 |
| Average | Average | |
| 3.5 cm | 6.175 cm | |
What part of the experimental procedure would most likely cause the results of the experiment to be less accurate?
The release of the marble from the meter stick.
Using a protractor to keep the meter stick at ninety degrees.
Al of these
Leveling the sand between trials.
The release of the marble from the meter stick.
The experimental procedure stated that the ball was rolled off the meter stick in order to keep the drop consistent and control for variables; however, this drop method could introduce variation into the study and make the results less accurate. For instance, the person rolling the object could use more or less force in between trials as a result of human error; therefore, trial results would be less accurate (i.e. crater size could differ based on more or less force applied prior to the drop). The use of the protractor and leveling of the sand keep variables constant and are not directly influencing the drop; therefore, these choices are incorrect. A mechanism meant to release the object should have been used instead of relying on human hands to carry out an integral part of the experiment.
Example Question #61 : Physics
Sometimes scientists need to scale down experiments because collecting full-scale data may not be practical or possible. Most of the time, the data collected during a small scale-experiment is an accurate indicator of full-scale results. For example, research of craters on the Earth’s surface has indicated that the Earth has experienced a history of massive meteor collisions. It has been hypothesized that, amongst other things, these impacting meteorites caused the Earth’s oceans to vaporize. The detrimental effects associated with meteor collisions would have made the planet to be uninhabitable to humans. Due to these adverse effects, an experiment that could produce meteor-sized craters would not be possible in a full-scale setting.
Researchers have developed small-scale experiments that are exemplary of Newton’s three laws of motion. Newton’s first law states that an object in motion will stay in motion unless it is acted on by another force. This phenomenon is known as inertia. The second law comes in the form of an equation that calculates how much force is exerted on two colliding objects with respect to mass and acceleration. In other words force is equal to the mass of an object multiplied by its acceleration. The third law states that for every action there is an equal and opposite reaction. In other words, forces always occur in pairs. A counter force that is equal in magnitude and opposite in direction compliments each force in a particular direction. For example, if you push downwards on a table then the table, in theory, pushes upwards with the same force.
In a particular small-scale exercise, students were asked to design an experiment in which two “meteorites” would be dropped into a medium of sand and the subsequent crater diameters would be measured. Afterwards, the sand would be leveled and the experiment would be repeated. The students were asked to identify all of the factors that could affect the formation of the craters. This was done in order to ensure that each experiment was testing one independent and one dependent variable at a time. Otherwise, it would be unclear which variable is causing the observed effect. Possible variables that could alter the outcome of the experiment included but were not limited to the following: height of the fall, speed of the “meteorite,” angle of impact, and the mass of meteorite.
Consider an experiment that seeks to identify the mass of the meteorite analog. All other variables would have to remain constant in order to ensure accurate results. In order to do this, the height of the fall was set to one meter. The object was placed on top of a vertical meter stick. In order to keep the acceleration and height of the drop constant, it was rolled off of the stick instead of being pushed or simply dropped. Last, a protractor was used to keep the meter stick at a ninety-degree angle. In the procedure, a marble and a golf ball were used as “meteorites” of different masses.
The results of the experiment were recorded in the table and figure provided.
| Crater Diameter (cm) | ||
| Trial Number | ||
| Marble (mass = 4g) | Golf ball (mass = 46g) | |
| 1 | 4.5 | 7.75 |
| 2 | 4.5 | 6 |
| 3 | 4 | 5.5 |
| 4 | 3 | 6 |
| 5 | 3 | 6.5 |
| 6 | 3.5 | 7 |
| 7 | 3 | 5 |
| 8 | 3 | 5 |
| 9 | 3 | 7 |
| 10 | 3.5 | 6 |
| Average | Average | |
| 3.5 cm | 6.175 cm | |
Which factor, other than mass and velocity, would cause the greatest change to the results of the experiment?
The age of the medium.
The surface temperature of the medium.
The rotation speed of the objects.
The consistency of the medium that the crater impacts.
The consistency of the medium that the crater impacts.
While the age of the medium, the temperature of the medium, and the rotational speed may play a role in the crater's size; however, the consistency of the medium will affect the crater size most. This phenomenon can be seen on the moon, where the dark side is much thicker than the side facing the earth. Because of this, the craters on the dark side of the moon are much smaller than the ones on the other side.
Example Question #31 : How To Find Experimental Design In Physics
Students are given an assignment to create a circuit from a given set of components. Four different students create circuits in unique manners and the professor measures the resistance of the circuit, the power output of the circuit and the heat given off by each circuit after each circuit was running for a certain amount of time. Circuits with resistors in parallel have a lower total resistance than those that have resistors in series.
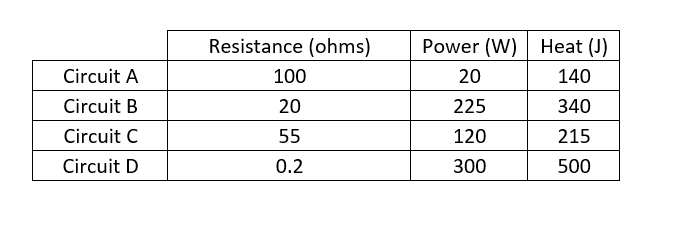
What other important information should be noted by the professor?
The amount of space (for example square feet or square inches) that the circuit takes up
How the amount of time the circuit is running affects the measured parameters
All of the other options
None of the other options
The duration of use for which the circuit can be run before the components fail
All of the other options
If the circuit is run for a certain amount of time the heat given off may be different than for other times. In addition, if the circuit is run for longer times some of the components may burn out. Knowing the size of the circuit will allow for the determination of what the circuit can be used for or what it is compatible with in terms of spacing. Knowing how long the circuit can be run before the components fail would be very useful in knowing. It would be useful to know all of the information that is presented as options.
Example Question #1181 : Act Science
Scientist 1: Scientist 1 believes that light displays particle behavior. This means that rays of light have their own associated momentum. Furthermore, Scientist 1 does not believe that light will exhibit wave behavior.
Scientist 2: Scientist 2 disagrees with Scientist 1 and believes that light can exhibit wave behavior, but does not display particle behavior. In other words, this scientist believes that light does not have any momentum.
Experiment: To settle their disagreement, the scientists setup the following experiment. The scientist take dark metallic material. This material is attached to pole and the metallic material can spin if it is subjected to a force; similar to a watermill or wind turbine. This setup is then placed outside and exposed to sunlight.
What is a potential issue with this experiment?
The metallic surface absorbs heat from the light and rotates due to temperature differences
The metallic surface may not be capable of rotating
It is a cloudy day outside so no sunlight is seen
All of the other answers
Light particles can pass through the metallic surface
The metallic surface absorbs heat from the light and rotates due to temperature differences
It can be assumed that the scientists will perform the experiment when it is sunny out and that the device is created properly. This indicates that light will not pass through the metallic surface, it can rotate correctly and it will be a sunny day. An issue that is difficult to correct is that sunlight gives off heat, which will be absorbed by a dark surface such as the metallic surface. This would increase the temperature of the surface causing it to rotate due to temperature differences.
Example Question #35 : How To Find Experimental Design In Physics
A scientist observed that when low energy types of electromagnetic radiation (light), such as visible light or ultraviolet light, were shone onto a conductive copper wire incorporated into a circuit with a light bulb as shown in Figure 1, the light bulb did not come on. However, when electromagnetic radiation of a higher energy, such as x-rays or gamma rays, was shone onto the wire, the light bulb did come on, indicating a current (electricity) was produced in the wire. The scientist hypothesized that this effect was due to the fact that electromagnetic radiation of a certain energy was able to overcome the attraction between electrons and protons in the individual atoms of copper in the wire, and liberate an electron to produce the electric current. He called this the photoelectric effect, and did the following experiments to further study this effect.

Figure 1
Experiment 1:
The scientist put a sample of copper in an instrument that can measure the energies of free-moving electrons. He shone a light source capable of producing specific energies of electromagnetic radiation on the metal and slowly increased the energy of the light. The instrument was used to measure the kinetic energies (energy due to motion) of any electrons that were liberated from the copper sample. The scientist recorded the energy of light used in frequency, where a low frequency corresponds to a low energy electromagnetic radiation, and a high frequency corresponds to a high frequency of electromagnetic radiation. He saw that no electrons could be detected at low frequencies, and that after a specific frequency he called the threshold frequency, the kinetic energy of liberated electrons increased linearly with increasing frequency of incident light as shown in Figure 2 below. The data was fitted with a line along which the data falls; the equation describing this line is shown in Figure 2.

Figure 2
Experiment 2:
The scientist removed the light bulb from the circuit shown in Figure 1 and replaced it with an instrument that can measure electrical charge. He then directed his x-ray source at the wire and slowly increased the intensity of the X-ray light while the frequency was held constant at 

Figure 3
The value corresponding to the binding energy of an electron to its positively charged nucleus is known as the work function, and corresponds to the y-intercept of the trend line produced when frequency of incident light is graphed against kinetic energy of liberated electrons. What is the work function for copper?
-1.3
-5.6
-4.7
2.2
-4.7
Frequency is graphed against kinetic energy of liberated electrons in Figure 2 for a sample of copper as mentioned in the description for Experiment 1. The equation describing the line that best fits the scientist's data is shown. As a line is given by y = mx + b, where b is the y-intercept, the y-intercept is -4.7.
Example Question #1183 : Act Science
A scientist observed that when low energy types of electromagnetic radiation (light), such as visible light or ultraviolet light, were shone onto a conductive copper wire incorporated into a circuit with a light bulb as shown in Figure 1, the light bulb did not come on. However, when electromagnetic radiation of a higher energy, such as x-rays or gamma rays, was shone onto the wire, the light bulb did come on, indicating a current (electricity) was produced in the wire. The scientist hypothesized that this effect was due to the fact that electromagnetic radiation of a certain energy was able to overcome the attraction between electrons and protons in the individual atoms of copper in the wire, and liberate an electron to produce the electric current. He called this the photoelectric effect, and did the following experiments to further study this effect.
Figure 1
Experiment 1:
The scientist put a sample of copper in an instrument that can measure the energies of free-moving electrons. He shone a light source capable of producing specific energies of electromagnetic radiation on the metal and slowly increased the energy of the light. The instrument was used to measure the kinetic energies (energy due to motion) of any electrons that were liberated from the copper sample. The scientist recorded the energy of light used in frequency, where a low frequency corresponds to a low energy electromagnetic radiation, and a high frequency corresponds to a high frequency of electromagnetic radiation. He saw that no electrons could be detected at low frequencies, and that after a specific frequency he called the threshold frequency, the kinetic energy of liberated electrons increased linearly with increasing frequency of incident light as shown in Figure 2 below. The data was fitted with a line along which the data falls; the equation describing this line is shown in Figure 2.
Figure 2
Experiment 2:
The scientist removed the light bulb from the circuit shown in Figure 1 and replaced it with an instrument that can measure electrical charge. He then directed his x-ray source at the wire and slowly increased the intensity of the X-ray light while the frequency was held constant at 
Figure 3
Figure 2 shows that the threshold frequency, in Hertz, for copper is most nearly:


The description of Experiment 1 defines threshold frequency as the frequency at which electrons are liberated from the sample and have measurable kinetic energies. The first data point appears at roughly 
Example Question #1181 : Act Science
A scientist observed that when low energy types of electromagnetic radiation (light), such as visible light or ultraviolet light, were shone onto a conductive copper wire incorporated into a circuit with a light bulb as shown in Figure 1, the light bulb did not come on. However, when electromagnetic radiation of a higher energy, such as x-rays or gamma rays, was shone onto the wire, the light bulb did come on, indicating a current (electricity) was produced in the wire. The scientist hypothesized that this effect was due to the fact that electromagnetic radiation of a certain energy was able to overcome the attraction between electrons and protons in the individual atoms of copper in the wire, and liberate an electron to produce the electric current. He called this the photoelectric effect, and did the following experiments to further study this effect.
Figure 1
Experiment 1:
The scientist put a sample of copper in an instrument that can measure the energies of free-moving electrons. He shone a light source capable of producing specific energies of electromagnetic radiation on the metal and slowly increased the energy of the light. The instrument was used to measure the kinetic energies (energy due to motion) of any electrons that were liberated from the copper sample. The scientist recorded the energy of light used in frequency, where a low frequency corresponds to a low energy electromagnetic radiation, and a high frequency corresponds to a high frequency of electromagnetic radiation. He saw that no electrons could be detected at low frequencies, and that after a specific frequency he called the threshold frequency, the kinetic energy of liberated electrons increased linearly with increasing frequency of incident light as shown in Figure 2 below. The data was fitted with a line along which the data falls; the equation describing this line is shown in Figure 2.
Figure 2
Experiment 2:
The scientist removed the light bulb from the circuit shown in Figure 1 and replaced it with an instrument that can measure electrical charge. He then directed his x-ray source at the wire and slowly increased the intensity of the X-ray light while the frequency was held constant at 
Figure 3
An electron has a negative electric charge of 
0.032
0.064
0.32
0.64
0.032
According to Figure 3, one photon produces ~0.032units on the y-axis. Dimensional analysis shows that:

Example Question #61 : Physics
A scientist observed that when low energy types of electromagnetic radiation (light), such as visible light or ultraviolet light, were shone onto a conductive copper wire incorporated into a circuit with a light bulb as shown in Figure 1, the light bulb did not come on. However, when electromagnetic radiation of a higher energy, such as x-rays or gamma rays, was shone onto the wire, the light bulb did come on, indicating a current (electricity) was produced in the wire. The scientist hypothesized that this effect was due to the fact that electromagnetic radiation of a certain energy was able to overcome the attraction between electrons and protons in the individual atoms of copper in the wire, and liberate an electron to produce the electric current. He called this the photoelectric effect, and did the following experiments to further study this effect.
Figure 1
Experiment 1:
The scientist put a sample of copper in an instrument that can measure the energies of free-moving electrons. He shone a light source capable of producing specific energies of electromagnetic radiation on the metal and slowly increased the energy of the light. The instrument was used to measure the kinetic energies (energy due to motion) of any electrons that were liberated from the copper sample. The scientist recorded the energy of light used in frequency, where a low frequency corresponds to a low energy electromagnetic radiation, and a high frequency corresponds to a high frequency of electromagnetic radiation. He saw that no electrons could be detected at low frequencies, and that after a specific frequency he called the threshold frequency, the kinetic energy of liberated electrons increased linearly with increasing frequency of incident light as shown in Figure 2 below. The data was fitted with a line along which the data falls; the equation describing this line is shown in Figure 2.
Figure 2
Experiment 2:
The scientist removed the light bulb from the circuit shown in Figure 1 and replaced it with an instrument that can measure electrical charge. He then directed his x-ray source at the wire and slowly increased the intensity of the X-ray light while the frequency was held constant at 
Figure 3
The circuit setup in Experiment 3 can be considered a solar cell as electricity is produced when the wire collects electromagnetic radiation. An important consideration in the development of solar cells is their efficiency, which can be defined as the ratio of electrons produced to photons incident on the material expressed as a percentage. What is the efficiency of the solar cell in Experiment 2?


Question 4 shows us that for every incident photon, 0.032 electrons are produced. Expressed as a percentage, that is:

Example Question #1185 : Act Science
A scientist observed that when low energy types of electromagnetic radiation (light), such as visible light or ultraviolet light, were shone onto a conductive copper wire incorporated into a circuit with a light bulb as shown in Figure 1, the light bulb did not come on. However, when electromagnetic radiation of a higher energy, such as x-rays or gamma rays, was shone onto the wire, the light bulb did come on, indicating a current (electricity) was produced in the wire. The scientist hypothesized that this effect was due to the fact that electromagnetic radiation of a certain energy was able to overcome the attraction between electrons and protons in the individual atoms of copper in the wire, and liberate an electron to produce the electric current. He called this the photoelectric effect, and did the following experiments to further study this effect.
Figure 1
Experiment 1:
The scientist put a sample of copper in an instrument that can measure the energies of free-moving electrons. He shone a light source capable of producing specific energies of electromagnetic radiation on the metal and slowly increased the energy of the light. The instrument was used to measure the kinetic energies (energy due to motion) of any electrons that were liberated from the copper sample. The scientist recorded the energy of light used in frequency, where a low frequency corresponds to a low energy electromagnetic radiation, and a high frequency corresponds to a high frequency of electromagnetic radiation. He saw that no electrons could be detected at low frequencies, and that after a specific frequency he called the threshold frequency, the kinetic energy of liberated electrons increased linearly with increasing frequency of incident light as shown in Figure 2 below. The data was fitted with a line along which the data falls; the equation describing this line is shown in Figure 2.
Figure 2
Experiment 2:
The scientist removed the light bulb from the circuit shown in Figure 1 and replaced it with an instrument that can measure electrical charge. He then directed his x-ray source at the wire and slowly increased the intensity of the X-ray light while the frequency was held constant at 
Figure 3
Why did the scientist hold the frequency of x-rays at 
This was the only frequency the x-ray source was capable of producing.
X-rays of 
X-rays of 
The scientist needed to hold one variable constant while changing the intensity of light, and this frequency had been shown to produce electrons in the copper.
The scientist needed to hold one variable constant while changing the intensity of light, and this frequency had been shown to produce electrons in the copper.
The scientific method requires that only one variable must be changed at a time to be able to correlate a change in results with the change made in the manipulated variable. The point of Experiment 2 is to study the result when the intensity of light is changed. Thus, the frequency of light must be held constant, as described in the correct answer. Secondly, as he is detecting liberated electrons, a frequency known to liberate them from Experiment 1 is needed. As the threshold frequency was shown to be 

Example Question #40 : How To Find Experimental Design In Physics
A scientist observed that when low energy types of electromagnetic radiation (light), such as visible light or ultraviolet light, were shone onto a conductive copper wire incorporated into a circuit with a light bulb as shown in Figure 1, the light bulb did not come on. However, when electromagnetic radiation of a higher energy, such as x-rays or gamma rays, was shone onto the wire, the light bulb did come on, indicating a current (electricity) was produced in the wire. The scientist hypothesized that this effect was due to the fact that electromagnetic radiation of a certain energy was able to overcome the attraction between electrons and protons in the individual atoms of copper in the wire, and liberate an electron to produce the electric current. He called this the photoelectric effect, and did the following experiments to further study this effect.
Figure 1
Experiment 1:
The scientist put a sample of copper in an instrument that can measure the energies of free-moving electrons. He shone a light source capable of producing specific energies of electromagnetic radiation on the metal and slowly increased the energy of the light. The instrument was used to measure the kinetic energies (energy due to motion) of any electrons that were liberated from the copper sample. The scientist recorded the energy of light used in frequency, where a low frequency corresponds to a low energy electromagnetic radiation, and a high frequency corresponds to a high frequency of electromagnetic radiation. He saw that no electrons could be detected at low frequencies, and that after a specific frequency he called the threshold frequency, the kinetic energy of liberated electrons increased linearly with increasing frequency of incident light as shown in Figure 2 below. The data was fitted with a line along which the data falls; the equation describing this line is shown in Figure 2.
Figure 2
Experiment 2:
The scientist removed the light bulb from the circuit shown in Figure 1 and replaced it with an instrument that can measure electrical charge. He then directed his x-ray source at the wire and slowly increased the intensity of the X-ray light while the frequency was held constant at 
Figure 3
What is the meaning of the slope in the regression equation for the data shown in Figure 1?
For every increase of one unit of frequency (in 
For every increase of one unit of kinetic energy (in eV) there is an increase in frequency of 
For every decrease of one unit of kinetic energy (in eV) there is an increase in frequency of 
For every increase of one unit of kinetic energy (in eV) there is an increase in frequency of 
For every increase of one unit of frequency (in
Slope is defined as rise over run. Thus, the slope indicates a ratio of a 4.1357-unit-increase in the y-value to an increase of 1 in the x-value. Figure 2 shows that the y-values are kinetic energies, given in eV, and that x-values are frequencies, given in units of 


All ACT Science Resources

