MAP 7th Grade Math : Statistics and Probability
Study concepts, example questions & explanations for MAP 7th Grade Math


All MAP 7th Grade Math Resources
Example Questions
Example Question #1 : Statistics And Probability
Kelly spun a spinner, which is pictured below, times. She recorded her results in the table provided. What is the experimental probability of the spinner landing on the yellow section?


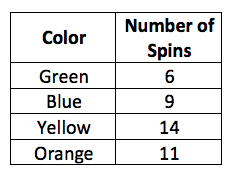


The experimental probability is what actually happened in an experiment. In this case, Kelly spun the spinner times, and she landed on yellow times; thus, our experimental probability is


Example Question #2 : Statistics And Probability
Samantha has a bag of marbles containing pink marbles, orange marble, red marbles, purple marbles, white marbles, black marble, green marbles, and yellow marble. What is the probability that Samantha will pick a red marble out of the bag?


In this problem we have a total of marbles. That means that each marble, regardless of color, has a chance of being picked, as shown in the images below. This image shows equal probability because each marble has a chance of being drawn, which is equal to the probability of all of the other marbles.


Samantha wants to know what her probability is of drawing a red marble out of her bag. Remember, probability is the number of favorable outcomes over the total number of outcomes:

For this problem there are red marbles; therefore,

}=\frac{2}{19}")
Example Question #3 : Statistics And Probability
A university wanted to compare the heights of women on the basketball team and women on the swim team. The data is in the dot plots provided.


Using the dot plots provided, what is the mean absolute deviation of the height of basketball players, rounded to the nearest tenth?


The mean absolute deviation is the average distance between each data point and the mean. So the first step to solving for the mean absolute deviation is to solve for the mean.
The mean is the average of a data set. In order to solve for the mean, we add all of our heights together, and divide by the number of people in our data set.

Next, we subtract to find the distance between each data point and , which is shown in the following table:

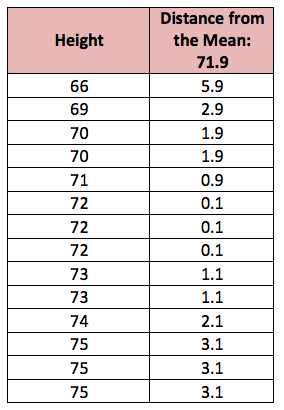
Now that we have all of the distances from the mean, we find the average of those differences to find the mean absolute deviation:


Certified Tutor


All MAP 7th Grade Math Resources

