ISEE Middle Level Math : Tables
Study concepts, example questions & explanations for ISEE Middle Level Math


All ISEE Middle Level Math Resources
Example Questions
Example Question #11 : Tables
Use the following table to answer the question.

What class did Craig have the highest grade in?


Let's look at the table.
We can see the first column lists all the students. The next column shows all of the classes. And the last column shows the grade they received in those classes.
Now, to find which class Craig received the highest grade, we must first locate Craig. We can see all of Craig's classes are at the very bottom of the table.
Now, we will look at the grade he got in each class by following along the rows with Craig's name.
We can see Craig's first class is Math. He received a B.
Craig's second class is Science. He received an A.
Craig's third class is Art. He received a B.
Knowing this, we can see the highest grade Craig received was an A. The class where he received an A was Science.
Therefore, the class that Craig received the highest grade was Science.
Example Question #11 : Tables
Use the following table to answer the question:
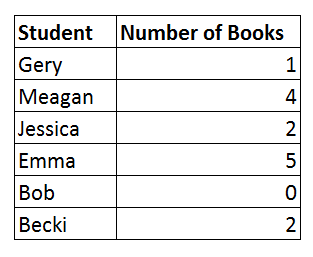
How many total books were borrowed by all of the students?


To answer the question, let's look at the table
We can see that the first column shows the students and the second column shows the number of books borrowed by each student.
We want to find the total number of books borrowed by all of the students. To answer this, we will simply add the number of books borrowed by each student. We get


Therefore, the total number of books borrowed by all of the students is 
Example Question #12 : Tables
Use the following table to answer the question:
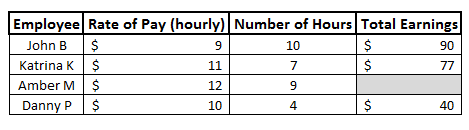
Fill in the blank.


To answer the question, let's look at the table.
We can see the first column shows the employees. The next column shows their rate of pay, or how much money they make every hour. The next column shows how many hours they worked. And the last column shows their total earning.
So, to find their total earnings, we can see that we multiply the rate of pay by the number of hours.
Therefore, to fill in the blank, we will do the same for that row. We can see the rate of pay is $12. We also see that the number of hours worked is 9. Now, we will multiply the two numbers together to find the total earnings. We get

Therefore, to fill in the blank, we get 
Example Question #301 : Data Analysis
Use the following table to answer the question:
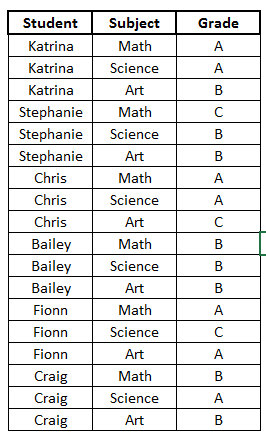
What grade did Chris receive in Science?


To answer the question, let's look at the table.
We can see the first column shows the different students, the next column shows the classes they are in, and the last column shows their grade in the class.
Now, to find what grade Chris received in Science, we will first locate Chris' name in the first column.
Now, we can see his name appears 3 times. If we look to the right, we can see his name matches up to 3 different classes: Math, Science, and Art. We want to know his grade in Science, so we will choose that row.
We will again look to the right to see the grade. We can see that it says A.
Therefore, the grade that Chris received in Science was an A.
Example Question #11 : Tables
Below is the list of candidates for Student Council president, along with the number of votes each won:

What percent of the students voted for Jarrow (nearest tenth)?


All ISEE Middle Level Math Resources

