All GRE Math Resources
Example Questions
Example Question #1 : Venn Diagrams
In a class, there are 15 students who like chocolate. 13 students like vanilla. 10 students like neither. If there are 35 people in the class, how many students like chocolate and vanilla?
3
10
2
25
13
3
In order to find the intersection of chocolate and vanilla, it is easiest to make a Venn Diagram. The outside of the Venn Diagram is 10, and the total of the entire diagram must equal 35. Therefore the two circles of the Venn Diagram including just chocolate, just vanilla and the intersection must equal 25, with the just chocolate plus intersection side equalling 15 and the just vanilla plus intersection side equalling 13.
We know:
(A U B) = A + B – (A ∩ B)
We have found that (A U B) = 25 and we are trying to find (A ∩ B). Plug in A and B
25 = 15 + 13 – (A ∩ B) = 28 – (A ∩ B)
or – (A ∩ B) = –3
(A ∩ B) = 3
Example Question #2 : Venn Diagrams
A given company has 1500 employees. Of those employees, 800 are computer science majors. 25% of those computer science majors are also mathematics majors. That group of computer science/math dual majors makes up one third of the total mathematics majors. How many employees have majors other than computer science and mathematics?
None of the other answers.
Refer to the following Venn Diagram:
If 25% of the 800 CS students are also mathematics students, the number of students sharing these majors is 800 * 0.25 or 200 students. Furthermore, if this represents one third of the total of math students, we then know:
Math students * 1/3 = 200 or (1/3)M = 200
Solving for M we get 600. This means that the number of students that are ONLY math students is 400.
Looking at our diagram above, we must be careful not to "double add" the intersection. The easiest way to do this is to take the intersection and add to it the number of CS-only and math-only students: 600 + 200 + 400 = 1200. This number represents the total number of students that have either a math or CS major (that is, the number of students in the union of the two sets). This leaves 1500 – 1200 or 300 students.
Example Question #3 : Venn Diagrams
In a population of cats, 10% are tabby colored, 5% are pregnant, and 3% are both tabby and pregnant. What is the probability that a cat is tabby but not pregnant?
Probability (tabby but not pregnant)
= Prob (tabby) – Prob (tabby and pregnant)
= 10% - 3%
= 7%
Example Question #2 : How To Find The Intersection Of A Venn Diagram
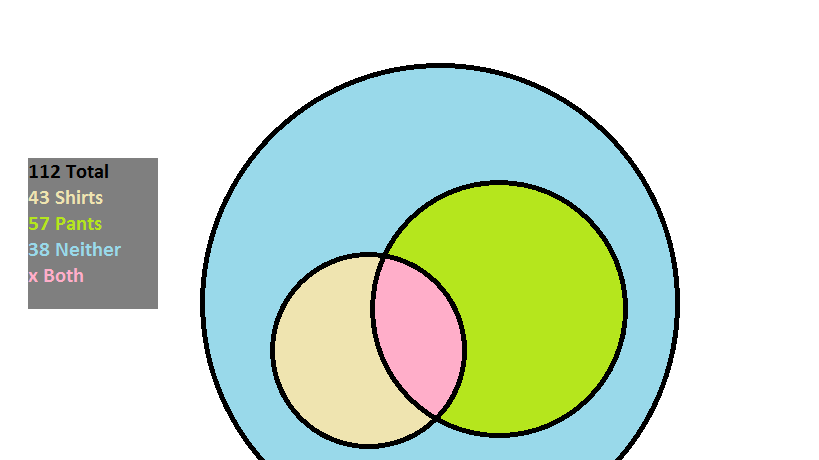
At an overpriced department store there are 


A way of solving this problem is by drawing a Venn diagram based on what is known:

There are 
The amount of individuals that purchased something is given as:
The reason that the number of shoppers that bought both is subtracted is so that it is not counted twice when the customers that bought pants and the customers that bought shirts are added together.
Since 
The amount that bought both then is:
Example Question #2 : How To Find The Intersection Of A Venn Diagram
In a school, 70 students are taking classes. 35 of them will be taking Accounting and 20 of them will be taking Economics. 7 of them are taking both of these classes. How many of the students are not in either class?
When you add both class rosters you get a total of 55 students

You must subtract the 7 that are in both because they are counted twice in the 55

The total in neither class will be the total students minus the adjusted enrollment in both classes

All GRE Math Resources


