Common Core: 7th Grade Math : Informally Assess the Degree of Visual Overlap in Data: CCSS.Math.Content.7.SP.B.3
Study concepts, example questions & explanations for Common Core: 7th Grade Math


All Common Core: 7th Grade Math Resources
Example Questions
Example Question #22 : Statistics & Probability
A university wanted to compare the heights of women on the basketball team and women on the swim team. The data is in the dot plots provided.


Using the dot plots provided, what are the visual overlaps?


All of the choices are correct

All of the choices are correct
The visual overlaps are heights that both dot graphs have in common. In this case, there are both swimmers and basketball players that are 


Example Question #23 : Statistics & Probability
A university wanted to compare the heights of women on the basketball team and women on the swim team. The data is in the dot plots provided.
Using the dot plots provided, what is the difference between the mean heights of basketball players and swimmers, rounded to the nearest tenth?


The mean is the average of a data set. In order to solve for the mean, we add all of our heights together, and divide by the number of people in our data set.
Basketball players:

Swimmers:

To find the different, we subtract our two means:

Example Question #1 : Informally Assess The Degree Of Visual Overlap In Data: Ccss.Math.Content.7.Sp.B.3
A university wanted to compare the heights of women on the basketball team and women on the swim team. The data is in the dot plots provided.
Using the dot plots provided, what is the mean height of the basketball players, rounded to the nearest tenth?


The mean is the average of a data set. In order to solve for the mean, we add all of our heights together, and divide by the number of people in our data set.

Example Question #731 : Grade 7
A university wanted to compare the heights of women on the basketball team and women on the swim team. The data is in the dot plots provided.
Using the dot plots provided, what is the mean absolute deviation of the height of basketball players, rounded to the nearest tenth?


The mean absolute deviation is the average distance between each data point and the mean. So the first step to solving for the mean absolute deviation is to solve for the mean.
The mean is the average of a data set. In order to solve for the mean, we add all of our heights together, and divide by the number of people in our data set.

Next, we subtract to find the distance between each data point and 
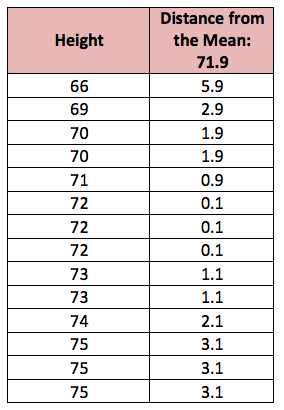
Now that we have all of the distances from the mean, we find the average of those differences to find the mean absolute deviation:

Example Question #731 : Grade 7
A university wanted to compare the heights of women on the basketball team and women on the swim team. The data is in the dot plots provided.
Using the dot plots provided, what is the median height of the basketball players?


The median is the middle number of a set of data points.
To solve for the median, we list our data points in order from least to greatest, and then find the number in the middle.

There are two numbers in the middle, so we take the average of the two numbers:

Example Question #6 : Informally Assess The Degree Of Visual Overlap In Data: Ccss.Math.Content.7.Sp.B.3
A university wanted to compare the heights of women on the basketball team and women on the swim team. The data is in the dot plots provided.
Using the dot plots provided, what is the median height of the swimmers?


The median is the middle number of a set of data points.
To solve for the median, we list our data points in order from least to greatest, and then find the number in the middle.

There are two numbers in the middle, so we take the average of the two numbers:

Example Question #731 : Grade 7
A university wanted to compare the heights of women on the basketball team and women on the swim team. The data is in the dot plots provided.
Using the dot plots provided, what is the difference in median heights of the basketball players and swimmers?


The median is the middle number of a set of data points.
To solve for the median, we list our data points in order from least to greatest, and then find the number in the middle.
Swimmers:

There are two numbers in the middle, so we take the average of the two numbers:

Basketball players:

There are two numbers in the middle, so we take the average of the two numbers:

Finally, we subtract to find the difference:

Example Question #732 : Grade 7
A university wanted to compare the heights of women on the basketball team and women on the swim team. The data is in the dot plots provided.
Using the dot plots provided, what is the difference between mean absolute deviation of the height of the basketball players and swimmer, rounded to the nearest tenth?


The mean absolute deviation is the average distance between each data point and the mean. So the first step to solving for the mean absolute deviation is to solve for the mean.
The mean is the average of a data set. In order to solve for the mean, we add all of our heights together, and divide by the number of people in our data set.
Basketball players:

Next, we subtract to find the distance between each data point and 
Now that we have all of the distances from the mean, we find the average of those differences to find the mean absolute deviation:

Swimmers:

Next, we subtract to find the distance between each data point and 

Now that we have all of the distances from the mean, we find the average of those differences to find the mean absolute deviation:

Now that we have each of the mean absolute deviations we can subtract to find the difference:

Example Question #9 : Informally Assess The Degree Of Visual Overlap In Data: Ccss.Math.Content.7.Sp.B.3
A university wanted to compare the heights of women on the basketball team and women on the swim team. The data is in the dot plots provided.
Using the dot plots provided, is there an outlier in the plot for basketball players? If yes, what is the outlier?
No
Yes,

Yes,

Yes,

Yes,
An outlier is a value in a data set that lies outside of the rang of the other data points. In this case, 

Example Question #1 : Informally Assess The Degree Of Visual Overlap In Data: Ccss.Math.Content.7.Sp.B.3
A university wanted to compare the heights of women on the basketball team and women on the swim team. The data is in the dot plots provided.
Using the dot plot for women swimmers, select the answer choice that provides the outlier for the set.

There is no outlier in this set


There is no outlier in this set
An outlier is a value in a data set that lies outside of the rang of the other data points. In this case all of the data points are together, and there are no big gaps between the heights. There is only 


All Common Core: 7th Grade Math Resources

