Award-Winning Statistics Tutors
serving Bronx, NY
Statistics
Tutors in Bronx
Private 1-on-1 tutoring, weekly live classes for academic support, test prep & enrichment, practice tests and diagnostics, and more to elevate grades and test scores.
Based on 3.4M Learner Ratings
UniversitiesSchools & Universities
DeliveredHours Delivered
ProficiencyGrowth in Proficiency
Who needs tutoring?
No obligation. Takes ~1 minute.
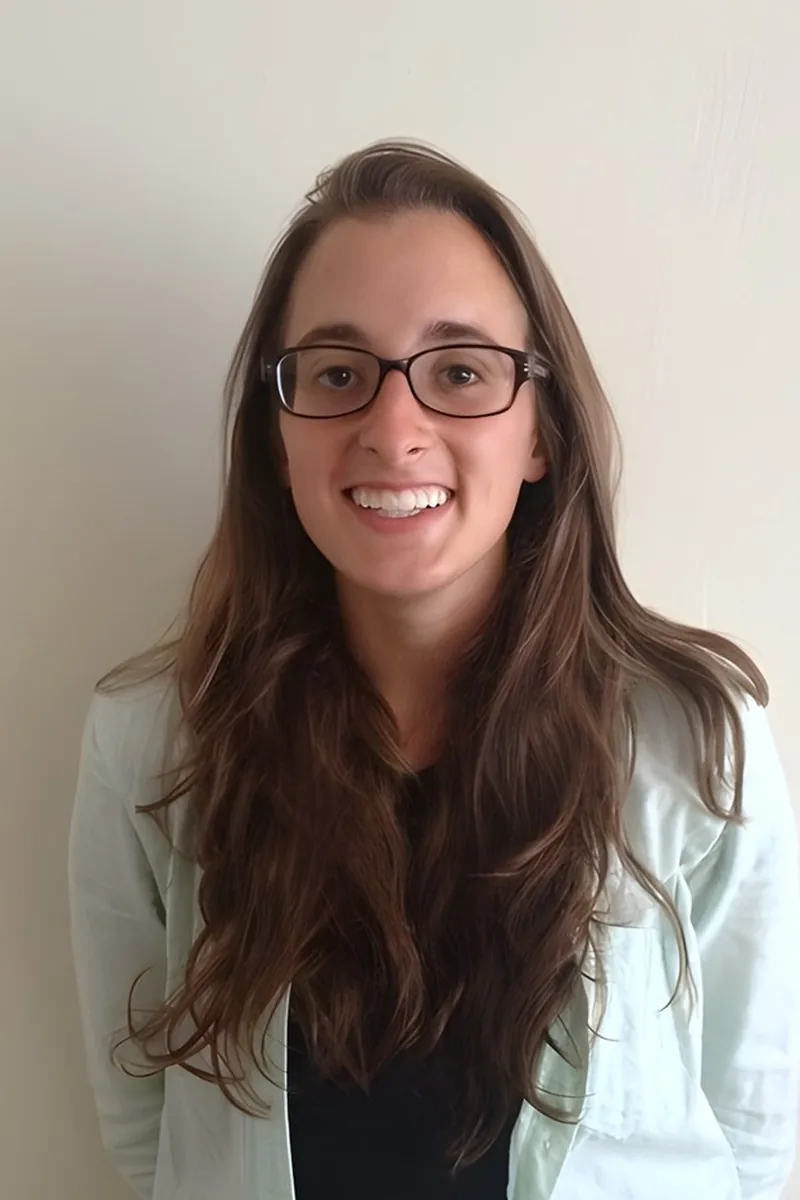
As a graduate student in environmental health sciences at Columbia's Mailman School, Laura uses statistical methods — probability distributions, hypothesis testing, regression analysis — in her own research. That real-world fluency means she can explain not just how to run a t-test or interpret a p-value, but why those tools matter and when to reach for them.

Currently taking business statistics at Fordham's Gabelli School of Business, Cole applies statistical reasoning to real financial datasets on a regular basis. He unpacks concepts like hypothesis testing, probability distributions, and regression analysis by grounding each one in a practical question — what does this data actually tell us, and why should we trust it?
Economics and statistics are practically inseparable, so Vicquaja doesn't just know the formulas — she understands what a confidence interval or regression coefficient actually tells you about real data. Her coursework at Allegheny College involves running statistical analyses regularly, from hypothesis testing to probability distributions. She teaches students to interpret output and think critically about what the numbers mean.
Probability distributions, hypothesis testing, and regression can feel like a foreign language the first time through. Nina breaks these concepts down by connecting them to real datasets and research questions drawn from her biostatistics training at Columbia and NYU. Rated 5.0 by students, she's especially effective at making the jump from formulas to interpretation feel intuitive.
A year as a course assistant in Harvard's math department gave Richard a front-row seat to where students get tripped up — and in statistics, it's almost always the jump from computing a value to interpreting what it means. He teaches concepts like variability, correlation, and probability by connecting the math to the kind of data-driven arguments he encounters in his government coursework, where a misread confidence interval can derail an entire policy claim.
Probability distributions, hypothesis testing, and confidence intervals all require a kind of careful reasoning about uncertainty that Allen sharpened through his economics coursework at Yale. He teaches statistics as a way of making arguments with data — interpreting p-values, choosing the right test, and understanding what a result actually means in context. His 5.0 rating speaks to how clearly he communicates these ideas.
Engineering Physics at Cornell requires serious statistical reasoning — error analysis, probability distributions, hypothesis testing — so Daniel brings a practical lens to statistics rather than a purely textbook one. He walks through concepts like standard deviation, regression, and confidence intervals by tying them to real data questions, which makes the logic behind each formula click.
A political science degree from Brown meant Lyall spent years interpreting polling data, regression models, and probability distributions in real research contexts. He brings that applied lens to statistics tutoring, connecting concepts like standard deviation and confidence intervals to situations where the numbers actually matter. Students get someone who treats stats as a tool for making arguments, not just a formula sheet to memorize.
Probability distributions, hypothesis testing, and regression analysis each require a different kind of thinking — and Rahi distinguishes clearly between the conceptual reasoning and the mechanical calculation so students know which skill a problem is actually testing. His applied mathematics background means he can explain the logic behind formulas like the Central Limit Theorem instead of just handing students a recipe to follow.
Jonathan holds an MS in Statistics, which means probability distributions, hypothesis testing, and regression analysis aren't just textbook topics for him — they're the core of his graduate training. He breaks down intimidating formulas like Bayes' theorem or ANOVA tables by connecting them to the real-world questions they were designed to answer.
Studying conducting at Juilliard means Molly lives in data — analyzing scores, interpreting patterns, and making decisions based on complex information. She brings that same analytical mindset to statistics, breaking down probability distributions, hypothesis testing, and data interpretation into logical steps. Her 5.0 client rating speaks to how clearly she communicates even the trickiest concepts.
Probability distributions and hypothesis testing trip students up when they try to memorize formulas without understanding what a p-value actually represents or why a sample size matters. Abismael connects statistical reasoning back to real engineering applications — quality control, experimental design, process variation — which makes abstract concepts like confidence intervals tangible. He's the kind of tutor who will quiz you with problems you haven't seen before, because that's what exams do.
Studying Statistics at NYU means Dennis doesn't just teach probability distributions and hypothesis testing from a textbook — he's actively working through these concepts in his own coursework. He's especially sharp at translating the notation-heavy language of statistics into plain English, which makes topics like confidence intervals and regression analysis far less intimidating.
Probability distributions and hypothesis testing trip students up when the notation obscures what's conceptually straightforward. Kiran breaks statistical reasoning into concrete steps — what the data looks like, what question you're actually asking, and which test answers it — drawing on the data analysis skills he's built across his physics and computer science coursework.
Every research methods course in Daniel's neuroscience program at Penn relies heavily on statistics — from designing experiments with proper controls to running t-tests and interpreting p-values. That daily exposure to real data analysis gives him a practical lens on probability distributions, hypothesis testing, and regression that most stats tutors can't offer.
I am currently working in a Bronx Public School as a teaching apprentice in Algebra. I have four years of experience tutoring one on one with students of all ages.
Understanding why you'd choose a t-test over a z-test, or what a standard deviation actually tells you about a dataset, matters more than plugging numbers into formulas. Blake runs statistical analyses as part of his neuroscience research at Vanderbilt, so he teaches distributions, hypothesis testing, and regression from firsthand experience with real data. He holds a 5.0 rating from students.
Probability distributions, hypothesis testing, and regression analysis all click faster when you understand the engineering problems they were designed to solve. Zora's Management Science and Engineering coursework at Stanford means she teaches statistics through real applications — modeling uncertainty, interpreting p-values, and designing experiments — not just formula sheets.
Whether it's choosing between a t-test and a z-test or interpreting a confidence interval correctly, statistics rewards precise language and careful setup. Victor digs into the logic of each procedure — why degrees of freedom matter, what a p-value actually measures — so students can handle unfamiliar problems instead of relying on pattern-matching from homework sets.
Probability distributions, hypothesis testing, and regression analysis each require a different kind of thinking than most math courses demand. Romeo unpacks the reasoning behind statistical methods so that concepts like p-values and confidence intervals actually make sense, not just as formulas to memorize but as tools for drawing real conclusions from data.
Probability distributions, hypothesis testing, confidence intervals — statistics is where math meets decision-making, and Frank's career as a Wall Street research executive was built on interpreting data under uncertainty. He's taught AP and college-level statistics to over two hundred classroom students and privately tutored dozens more. That volume of teaching means he can quickly diagnose where a student's reasoning breaks down, whether it's setting up the null hypothesis or choosing the right test.
Probability distributions, hypothesis testing, and confidence intervals all click faster when you understand the story the data is telling. Kelsey's molecular biology training gave her years of practice designing experiments and interpreting statistical results, so she connects each formula to the reasoning behind it rather than treating stats as pure computation.
Studying Evolutionary Anthropology at Duke gave Benjamin a hands-on relationship with statistics — analyzing population data, running hypothesis tests, and interpreting p-values were regular parts of his research coursework. He tackles concepts like normal distributions, regression, and confidence intervals by grounding them in real datasets rather than abstract notation. His 5.0 rating speaks to an approach that makes even probability theory feel intuitive.
Brandon approaches statistics through the lens of his biomedical engineering training, where interpreting data distributions, running hypothesis tests, and understanding p-values aren't abstract exercises — they're how you decide whether a medical device actually works. He breaks down concepts like standard deviation and confidence intervals using concrete examples that make the logic click. Rated 5.0 by students.
A Cornell student carrying a 4.0 GPA, Charlie treats statistics as a subject about storytelling with data — understanding what a standard deviation actually reveals, why a sample size matters, or when a correlation is misleading. He connects probability distributions and hypothesis testing to real-world scenarios that make the logic behind the formulas intuitive rather than abstract.
With an MBA in finance and a computer science degree, John sits at the intersection where statistical theory meets real application — he's used regression models to evaluate financial instruments and written code to automate data analysis. That dual fluency means he can walk students through concepts like confidence intervals or hypothesis testing from both the mathematical and the practical side, clarifying not just the procedure but what the output actually means.
Understanding statistics means learning to think critically about data — not just computing a standard deviation but knowing what it actually tells you about a distribution. Kimberly's psychology research background at Wesleyan and her current biostatistics coursework at Columbia mean she's tackled everything from t-tests to regression analysis in applied settings. She teaches the reasoning behind each method so the formulas stop feeling arbitrary.
Angelina earned her bachelor's degree in statistics, so probability distributions, hypothesis testing, and regression analysis aren't just textbook topics for her — they're the core of her academic training. She breaks down the logic behind formulas so students can interpret results and set up problems on their own, not just follow steps. Rated 5.0 by students.
Data Science is half of Diego's double major at NYU Courant, so statistics isn't something he learned once and moved on from — it's embedded in his daily coursework. He digs into everything from probability distributions to linear regression with an emphasis on understanding what the numbers actually tell you, not just computing them.
Law school runs on evidence and argument, which turns out to be exactly what statistics is about — evaluating claims, understanding distributions, and knowing when a p-value actually means something. Mustafa connects probability and inference to real decision-making scenarios, making concepts like confidence intervals and hypothesis testing feel less abstract.
Studying statistics at Cornell every day gives Katie a depth of understanding that goes well beyond intro-level coursework. Whether the topic is probability distributions, hypothesis testing, or regression analysis, she connects the formulas to what they actually measure — making the subject intuitive rather than mechanical.
Probability distributions, hypothesis testing, z-scores — statistics asks students to think in a way that's fundamentally different from other math courses. Jeremy earned an economics degree, which means he spent years interpreting data, running regressions, and translating statistical output into plain language. He teaches students to understand what a p-value actually means rather than just plugging numbers into formulas.
Probability distributions, hypothesis testing, and regression analysis all require a kind of reasoning that's different from the rest of math — less computation, more interpretation. With a background in economics, Orlando understands how statistical tools get applied to real questions and teaches the material through that lens, making p-values and standard deviations feel purposeful rather than abstract.
Probability distributions, hypothesis testing, confidence intervals — Sabry taught these concepts repeatedly as a co-instructor for both undergraduate and graduate courses at the University at Buffalo. His engineering PhD means he approaches statistics through real data and applied problems, connecting abstract formulas to the physical experiments and modeling scenarios where they actually matter.
Probability distributions, hypothesis testing, confidence intervals — statistics is a subject where the vocabulary alone can be a barrier before the math even starts. Dana, who holds a statistics degree and applies statistical methods in her economics research, teaches each concept by grounding it in a concrete question: what claim are we testing, what does the data actually tell us, and how confident should we be? She's rated 4.8 across her tutoring subjects.
I am currently finishing my thesis. For the past two years I was an adjunct instructor at The City College of New York, teaching statistics and introductory neuroscience, where I learned the importance of communicating complicated concepts clearly at an individualized level. All of my classes performed above average, and I discovered how satisfying it is to help people understand difficult ideas. I've found that by creating a good rapport with my students I am able to more effectively impart difficult concepts to them while causing them less stress. My passion is people, which first led me to study psychology, leading to my work in statistics, and later into teaching.
I am highly praised by my students and supervisors. Even today I still kept the communication with many students.
Years of teaching math across every level from pre-algebra through calculus gave James an unusual edge in statistics — he can trace a concept like standard deviation back to the arithmetic and algebraic reasoning a student already understands, making the leap to statistical thinking feel manageable. His master's in education means he's trained to spot exactly where confusion sets in, whether it's interpreting p-values or setting up a hypothesis test, and rework the explanation on the spot. Rated 5.0 by students.
I am currently a sophomore at the NYU Stern School of Business. My hobbies and interests include reading, exercising, and following sports such as baseball and tennis. I love Math, Spanish, and Grammar, and would love to help you if you are having trouble in any of those subjects!
Interpreting a p-value or choosing between a z-test and a t-test requires a kind of careful reading that Carmen, with her literature background, is unusually good at teaching. She treats every statistics problem as a story — what's the claim, what's the evidence, and what does the data actually support? That analytical lens makes hypothesis testing and confidence intervals far more intuitive.
Testimonials
Because the right Statistics tutor makes all the difference.
Average Session Rating – Based on 3.4M Learner Ratings
Practice Statistics
Free practice tests, flashcards, and AI tutoring for Statistics
Nearby Statistics Tutors
Other Bronx Tutors
Related Math Tutors in Bronx
Frequently Asked Questions
Statistics requires both conceptual understanding and practical application—students need to grasp why methods work, not just memorize formulas. Many students struggle with interpreting data, understanding probability concepts, and translating real-world problems into statistical analyses. Personalized tutoring helps students move beyond procedural steps to see the underlying patterns and connections that make Statistics click.
Students often struggle with word problems that require translating context into statistical language, understanding when to use different tests (t-tests, chi-square, ANOVA), and interpreting p-values and confidence intervals correctly. Many also find probability counterintuitive and get stuck on hypothesis testing logic. Personalized instruction helps break down these concepts step-by-step and builds confidence in problem-solving strategies.
Your first session is about understanding your specific needs—whether you're preparing for AP Statistics, a college course, or struggling with particular topics like regression or experimental design. Tutors will assess your current understanding, identify knowledge gaps, and create a personalized plan tailored to your learning style and goals. This foundation ensures every session after builds exactly what you need.
Yes. Statistics is taught through different approaches across Bronx schools—some emphasize computational methods, others focus on conceptual understanding, and some integrate technology like R or Python. Tutors connect with students using whatever curriculum and materials their school uses, ensuring seamless alignment with classroom instruction and helping students succeed on their specific exams and assignments.
Statistics isn't just about getting the right answer—teachers want to see your reasoning and method. Tutors guide students to articulate why they chose a particular test, how they set up hypotheses, and what their results mean in context. This builds the communication skills that matter on exams, projects, and in real-world applications where explaining your analysis is just as important as the numbers.
Absolutely. Statistics anxiety often stems from feeling lost in unfamiliar concepts or worried about making mistakes. Working 1-on-1 with a tutor creates a judgment-free space to ask questions, work through problems at your own pace, and build confidence through incremental success. Many students find that understanding the 'why' behind statistical methods transforms anxiety into curiosity.
Varsity Tutors connects you with tutors who have deep expertise in Statistics and understand the specific challenges students face. You can share your goals, current struggles, and preferred learning style, and we'll match you with someone who's a great fit for your needs. The process is straightforward—get connected, start learning, and see results.
Statistics is everywhere—from medical research and business analytics to social science and public policy. Tutors help students see how the concepts they're learning apply beyond the classroom, which deepens understanding and motivation. Whether you're analyzing survey data, understanding experimental results, or exploring data in a field you care about, personalized instruction makes Statistics feel relevant and powerful.
Let’s find your perfect tutor
Answer a few quick questions. We’ll recommend the right plan and match you with a top 5% tutor.