Introduction to Factor Markets
Help Questions
AP Microeconomics › Introduction to Factor Markets
To maximize profit, a firm should continue to hire units of a factor of production as long as the factor's
average product is greater than its marginal product.
price of the final good is greater than the factor's marginal resource cost.
marginal product is greater than its average product.
marginal revenue product is greater than or equal to its marginal resource cost.
Explanation
B is correct. This is the optimal hiring rule. A firm will continue to add an input if the additional revenue it generates (MRP) is at least as large as the additional cost it incurs (MRC). Profit is maximized at the quantity where MRP = MRC. A is related to production efficiency but not profit maximization. C is incorrect. D compares two unrelated metrics (price of output vs. cost of input) without considering the input's productivity.
A local pizza parlor is a 'wage taker' in the market for its employees. This indicates that the pizza parlor
hires labor in a monopsonistic market environment.
can hire any number of workers at the going market wage.
can set the wage for its workers to minimize its costs.
must negotiate wages with a powerful labor union.
Explanation
C is correct. A 'wage taker' operates in a perfectly competitive labor market. This means the firm is a small part of the total labor market and its hiring decisions do not affect the market wage. Therefore, it faces a perfectly elastic (horizontal) supply of labor and can hire as many workers as it needs at that wage. A describes a bilateral monopoly situation. B is the opposite of a competitive market. D describes a firm with monopsony power, not a wage taker.
For a firm that is a perfect competitor in the labor market, the marginal resource cost (MRC) of labor is
equal to the market wage rate because the firm can hire any quantity of labor at the prevailing wage.
equal to the marginal revenue product of the last worker hired when the firm is maximizing profits.
greater than the wage rate because hiring more workers requires raising the wage for all existing workers.
less than the wage rate because of the diminishing marginal product of labor as more workers are hired.
Explanation
B is correct. A perfectly competitive firm in the labor market is a 'wage taker,' meaning it can hire as many workers as it wishes at the market wage without influencing the wage. Thus, the additional cost of hiring one more worker (the MRC) is simply the constant market wage rate. A describes the MRC for a monopsonist. C is incorrect; diminishing marginal product affects the MRP, not the MRC. D describes the profit-maximizing condition (MRP = MRC), not the definition of MRC for a wage-taking firm.
A competitive labor market exists for landscapers. Based on the labor market shown in the table, what is the equilibrium wage and quantity of labor employed?
(Quantity of labor is measured in number of workers.)
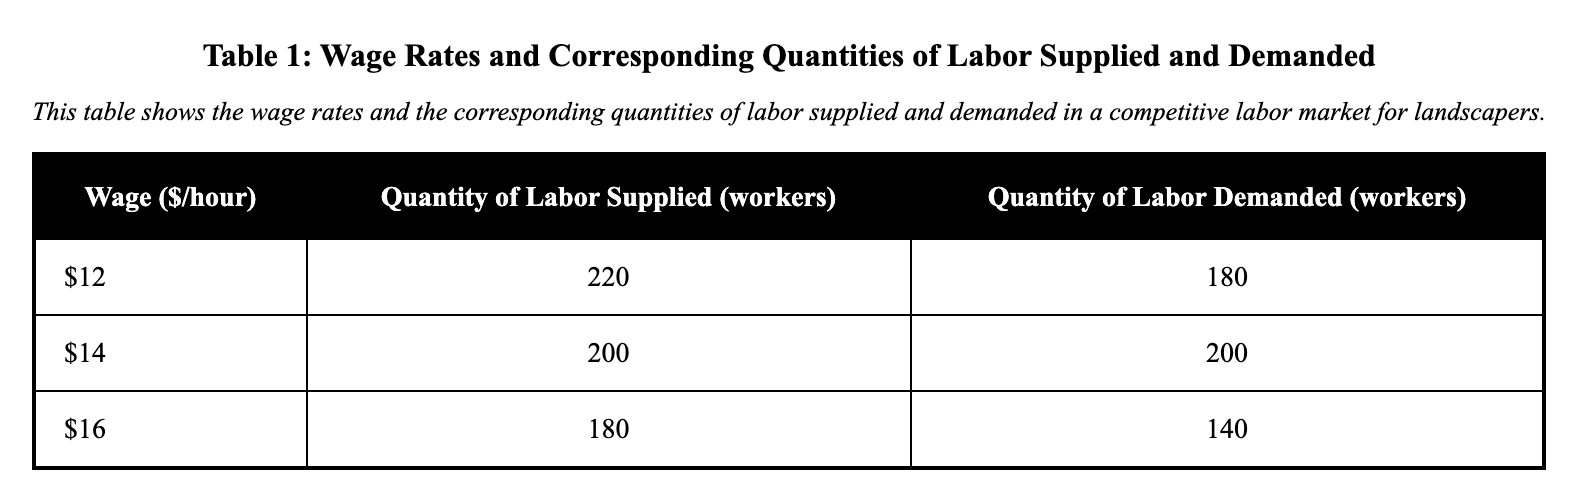
$$w=\14\text{/hour and }L=180\text{ workers}$$
$$w=\12\text{/hour and }L=180\text{ workers}$$
$$w=\12\text{/hour and }L=220\text{ workers}$$
$$w=\16\text{/hour and }L=140\text{ workers}$$
$$w=\14\text{/hour and }L=200\text{ workers}$$
Explanation
This question tests your ability to identify equilibrium in factor markets, specifically in a competitive labor market for landscapers. Labor demand represents firms' willingness to hire based on derived demand—the demand for landscaping services creates demand for landscapers. The table displays wage rates with corresponding quantities of labor supplied and demanded. Equilibrium occurs where these quantities are equal: at $w = \$14/\text{hour}$, both supply and demand equal 200 workers. A common error is selecting a point where supply or demand alone equals a nice round number, rather than where they intersect. To find labor market equilibrium, systematically compare the supply and demand columns row by row. The equilibrium wage and employment level appear where these values match exactly.
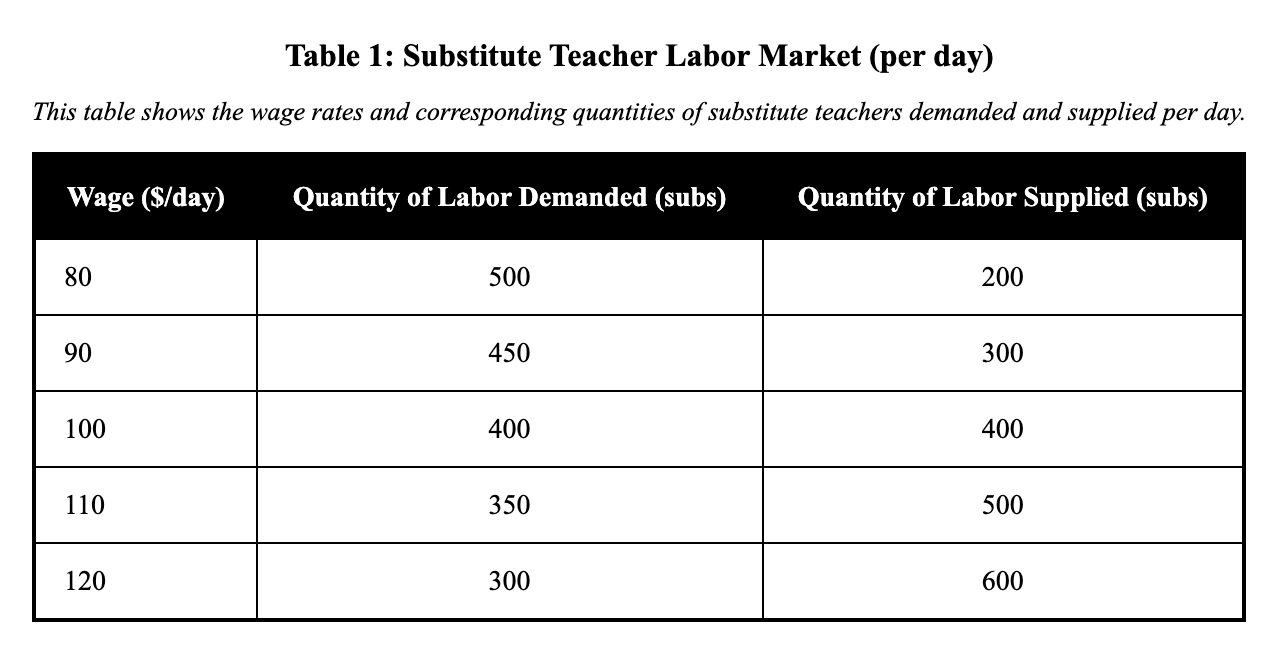
A labor market for substitute teachers is shown in the table below. Labor demand is derived from the marginal revenue product (MRP) of substitute teachers. Based on the labor market shown, what is the equilibrium wage and employment?
Table: Substitute Teacher Labor Market (per day)
- Wage ($/day): 80, 90, 100, 110, 120
- Quantity of labor demanded (subs): 500, 450, 400, 350, 300
- Quantity of labor supplied (subs): 200, 300, 400, 500, 600
$120 per day and 300 subs
$100 per day and 400 subs
$80 per day and 200 subs
$110 per day and 500 subs
$90 per day and 450 subs
Explanation
The skill here is the introduction to factor markets. Derived demand is the demand for a resource that depends on the demand for the product it helps create, and labor demand is determined by the marginal revenue product (MRP), which measures the additional revenue from hiring one more worker. The table presents the quantities of substitute teachers demanded and supplied at various wage rates. The equilibrium is at $100 per day and 400 subs because this is the point where quantity demanded equals quantity supplied. A common misconception is that labor demand is direct like consumer goods, but it is derived from the product's demand unlike direct demand for the good itself. A transferable strategy is to trace the MRP to understand the downward-sloping labor demand curve. Finally, read the equilibrium wage and employment from the intersection of the labor demand and supply curves.
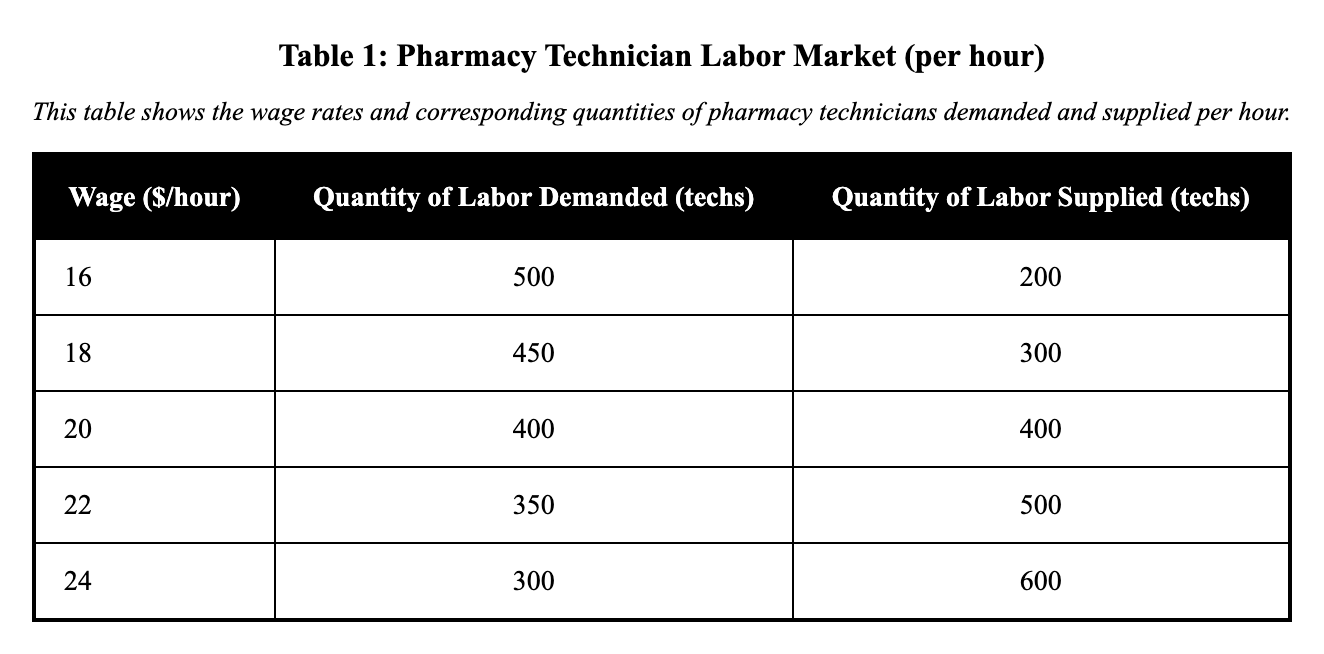
A labor market for pharmacy technicians is shown in the table below. Labor demand is derived from the marginal revenue product (MRP) of technicians. Based on the labor market shown, what is the equilibrium wage and employment?
Table: Pharmacy Technician Labor Market (per hour)
- Wage ($/hour): 16, 18, 20, 22, 24
- Quantity of labor demanded (techs): 500, 450, 400, 350, 300
- Quantity of labor supplied (techs): 200, 300, 400, 500, 600
$18 per hour and 300 techs
$16 per hour and 200 techs
$20 per hour and 400 techs
$24 per hour and 600 techs
$22 per hour and 350 techs
Explanation
The skill here is the introduction to factor markets. Derived demand is the demand for a resource that depends on the demand for the product it helps create, and labor demand is determined by the marginal revenue product (MRP), which measures the additional revenue from hiring one more worker. The table presents the quantities of pharmacy technicians demanded and supplied at various wage rates. The equilibrium is at $20 per hour and 400 techs because this is the point where quantity demanded equals quantity supplied. A common misconception is that labor demand is direct like consumer goods, but it is derived from the product's demand unlike direct demand for the good itself. A transferable strategy is to trace the MRP to understand the downward-sloping labor demand curve. Finally, read the equilibrium wage and employment from the intersection of the labor demand and supply curves.
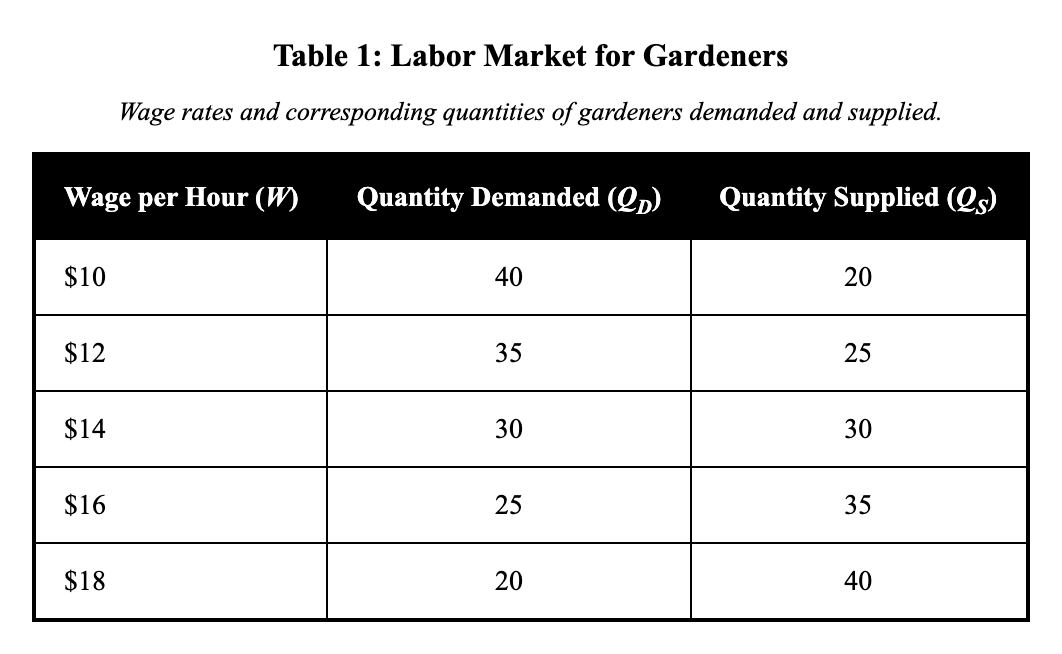
A landscaping company hires gardeners in a competitive labor market. Based on the labor market shown in the table, what is the equilibrium wage and quantity of labor (gardeners) employed?
Labor market table (wage per hour, $W$):
- At $W = $10: $Q_D = 40$ gardeners, $Q_S = 20$ gardeners
- At $W = $12: $Q_D = 35$ gardeners, $Q_S = 25$ gardeners
- At $W = $14: $Q_D = 30$ gardeners, $Q_S = 30$ gardeners
- At $W = $16: $Q_D = 25$ gardeners, $Q_S = 35$ gardeners
- At $W = $18: $Q_D = 20$ gardeners, $Q_S = 40$ gardeners
$W = $10 per hour and 40 gardeners
$W = $14 per hour and 30 gardeners
$W = $18 per hour and 20 gardeners
$W = $16 per hour and 35 gardeners
$W = $12 per hour and 25 gardeners
Explanation
This question tests your understanding of factor markets, where firms demand labor and workers supply it. In factor markets, the demand for labor is a derived demand—firms hire workers based on how much revenue those workers can generate from producing goods or services. The table shows the labor market for gardeners, with quantity demanded (QD) and quantity supplied (QS) at different wage rates. To find equilibrium, look for where QD equals QS: at W = $14, both QD and QS equal 30 gardeners. A common misconception is confusing factor markets with product markets—remember that in factor markets, firms are the demanders and workers are the suppliers. The key strategy is to scan the table systematically, comparing QD and QS at each wage level. When they match, you've found the equilibrium wage and employment level.
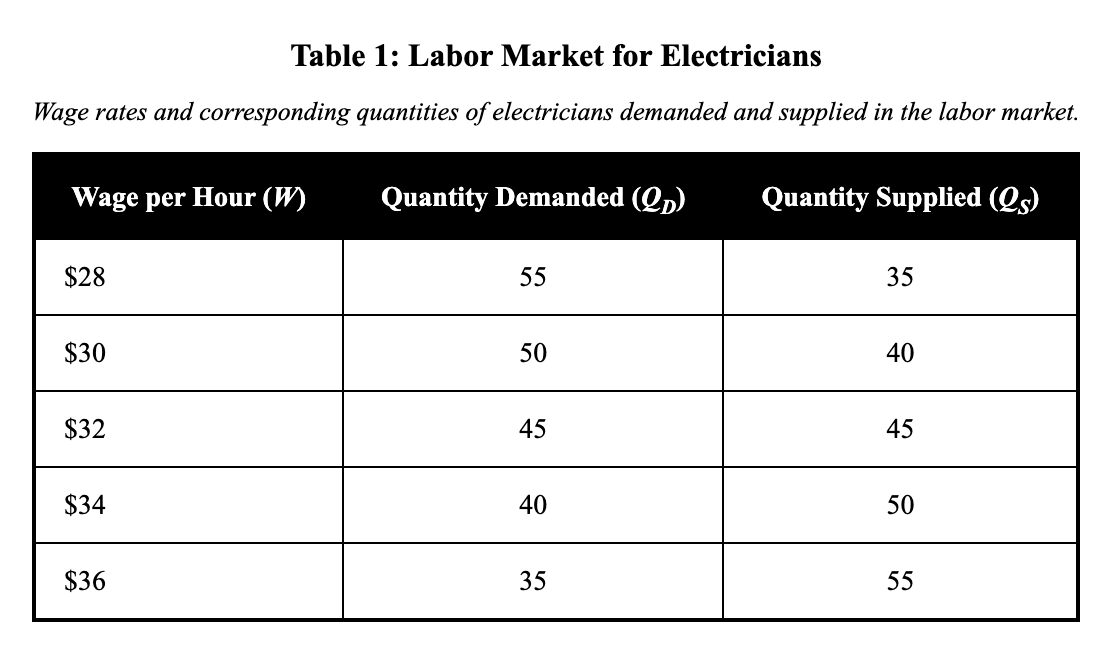
A construction firm hires electricians in a competitive labor market. Based on the labor market shown in the table, what is the equilibrium wage and quantity of labor (electricians) employed?
Labor market table (wage per hour, $W$):
- At $W = $28: $Q_D = 55$ electricians, $Q_S = 35$ electricians
- At $W = $30: $Q_D = 50$ electricians, $Q_S = 40$ electricians
- At $W = $32: $Q_D = 45$ electricians, $Q_S = 45$ electricians
- At $W = $34: $Q_D = 40$ electricians, $Q_S = 50$ electricians
- At $W = $36: $Q_D = 35$ electricians, $Q_S = 55$ electricians
$W = $32 per hour and 45 electricians
$W = $28 per hour and 55 electricians
$W = $30 per hour and 40 electricians
$W = $36 per hour and 35 electricians
$W = $34 per hour and 50 electricians
Explanation
This question tests understanding of factor markets in the construction industry for electricians. In factor markets, construction firms demand electricians based on derived demand—they hire electricians because clients demand electrical work in buildings, not because firms want electricians directly. The table shows different wage rates with corresponding quantities demanded and supplied. To find equilibrium, locate where QD equals QS: at W = $32 per hour, both quantity demanded and quantity supplied equal 45 electricians. A common error is assuming the highest wage means the best outcome—equilibrium occurs where supply and demand balance, regardless of wage level. The transferable strategy involves systematically checking each row in the table, comparing demand and supply quantities. When these match, you've identified both the equilibrium wage rate and the equilibrium quantity of labor employed.
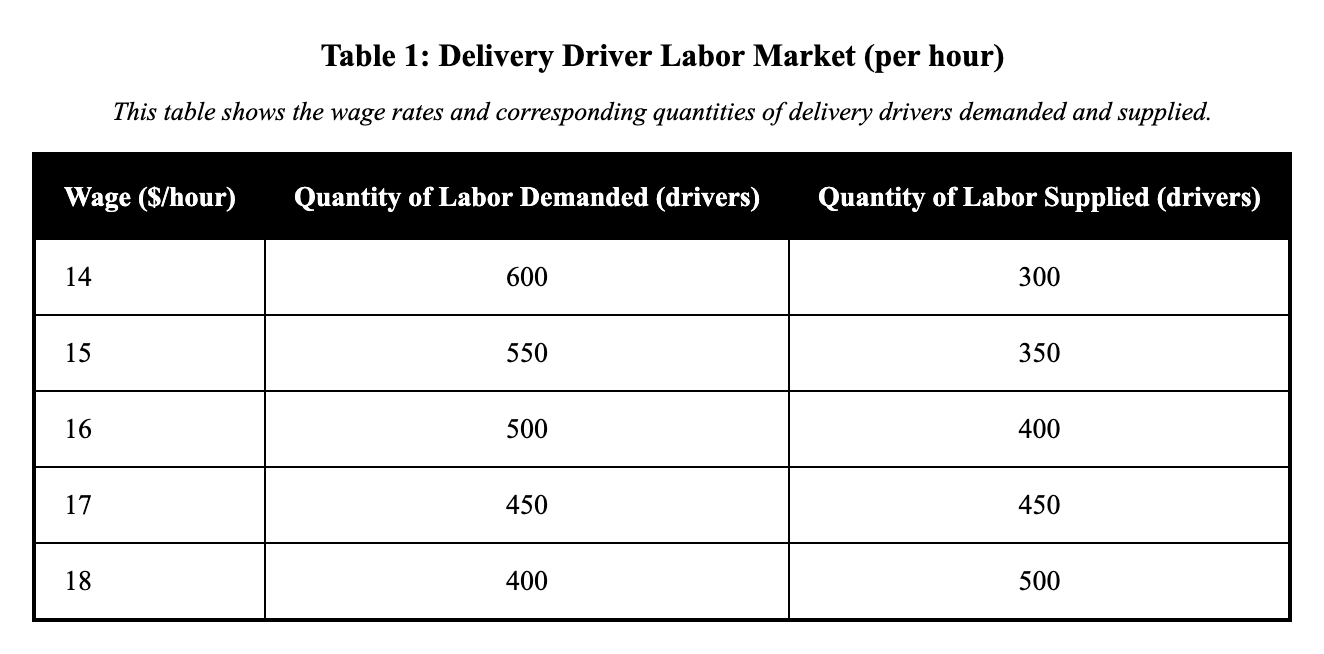
A labor market for delivery drivers is shown in the table below. Labor demand is derived from the marginal revenue product (MRP) of drivers. Based on the labor market shown, what is the equilibrium wage and employment?
Table: Delivery Driver Labor Market (per hour)
- Wage ($/hour): 14, 15, 16, 17, 18
- Quantity of labor demanded (drivers): 600, 550, 500, 450, 400
- Quantity of labor supplied (drivers): 300, 350, 400, 450, 500
$18 per hour and 500 drivers
$15 per hour and 350 drivers
$16 per hour and 500 drivers
$14 per hour and 600 drivers
$17 per hour and 450 drivers
Explanation
The skill here is the introduction to factor markets. Derived demand is the demand for a resource that depends on the demand for the product it helps create, and labor demand is determined by the marginal revenue product (MRP), which measures the additional revenue from hiring one more worker. The table presents the quantities of delivery drivers demanded and supplied at various wage rates. The equilibrium is at $17 per hour and 450 drivers because this is the point where quantity demanded equals quantity supplied. A common misconception is that labor demand is direct like consumer goods, but it is derived from the product's demand unlike direct demand for the good itself. A transferable strategy is to trace the MRP to understand the downward-sloping labor demand curve. Finally, read the equilibrium wage and employment from the intersection of the labor demand and supply curves.
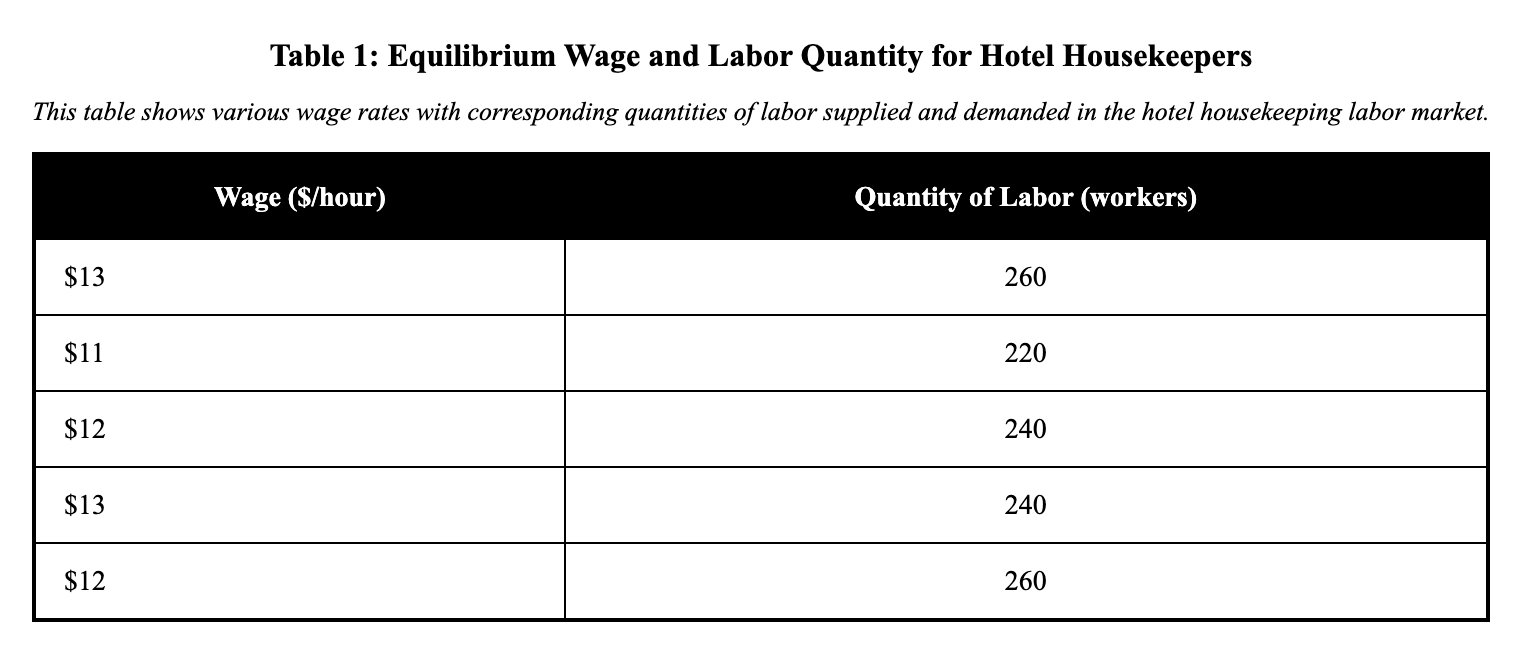
A competitive labor market exists for hotel housekeepers. Based on the labor market shown in the table, what is the equilibrium wage and quantity of labor employed?
(Quantity of labor is measured in number of workers.)
$$w=\12\text{/hour and }L=240\text{ workers}$$
$$w=\13\text{/hour and }L=260\text{ workers}$$
$$w=\11\text{/hour and }L=220\text{ workers}$$
$$w=\12\text{/hour and }L=260\text{ workers}$$
$$w=\13\text{/hour and }L=240\text{ workers}$$
Explanation
This question tests your understanding of equilibrium in factor markets, specifically for hotel housekeepers. In factor markets, labor demand is derived demand—hotels hire housekeepers because guests demand clean rooms, not because of direct demand for housekeeping labor. The table shows various wage rates with corresponding quantities of labor supplied and demanded. Market equilibrium occurs where quantity supplied equals quantity demanded: at w=$12/hour, both equal 240 workers. A common mistake is looking for the highest or lowest wage rather than the intersection point of supply and demand. To solve these problems efficiently, scan down the table comparing the supply and demand columns. Stop when you find matching values—this row gives you both the equilibrium wage and employment level.