Graphs
Help Questions
PSAT Math › Graphs
A teacher gives a quiz and records students’ scores. The histogram shows how many students scored in each range: 50–59, 60–69, 70–79, 80–89, and 90–99. According to the histogram, how many students scored at least 80? Add the frequencies for the 80–89 and 90–99 bins.
14 students
16 students
10 students
12 students
Explanation
The question asks for the total number of students who scored at least 80 on the quiz. From the histogram, I need to identify the bins for scores 80-89 and 90-99, then add their frequencies. The 80-89 bin shows 8 students and the 90-99 bin shows 6 students. Adding these together: 8 + 6 = 14 students scored at least 80. A common mistake is including the 70-79 bin or only counting one of the two relevant bins, so carefully identify which score ranges meet the "at least 80" criterion.
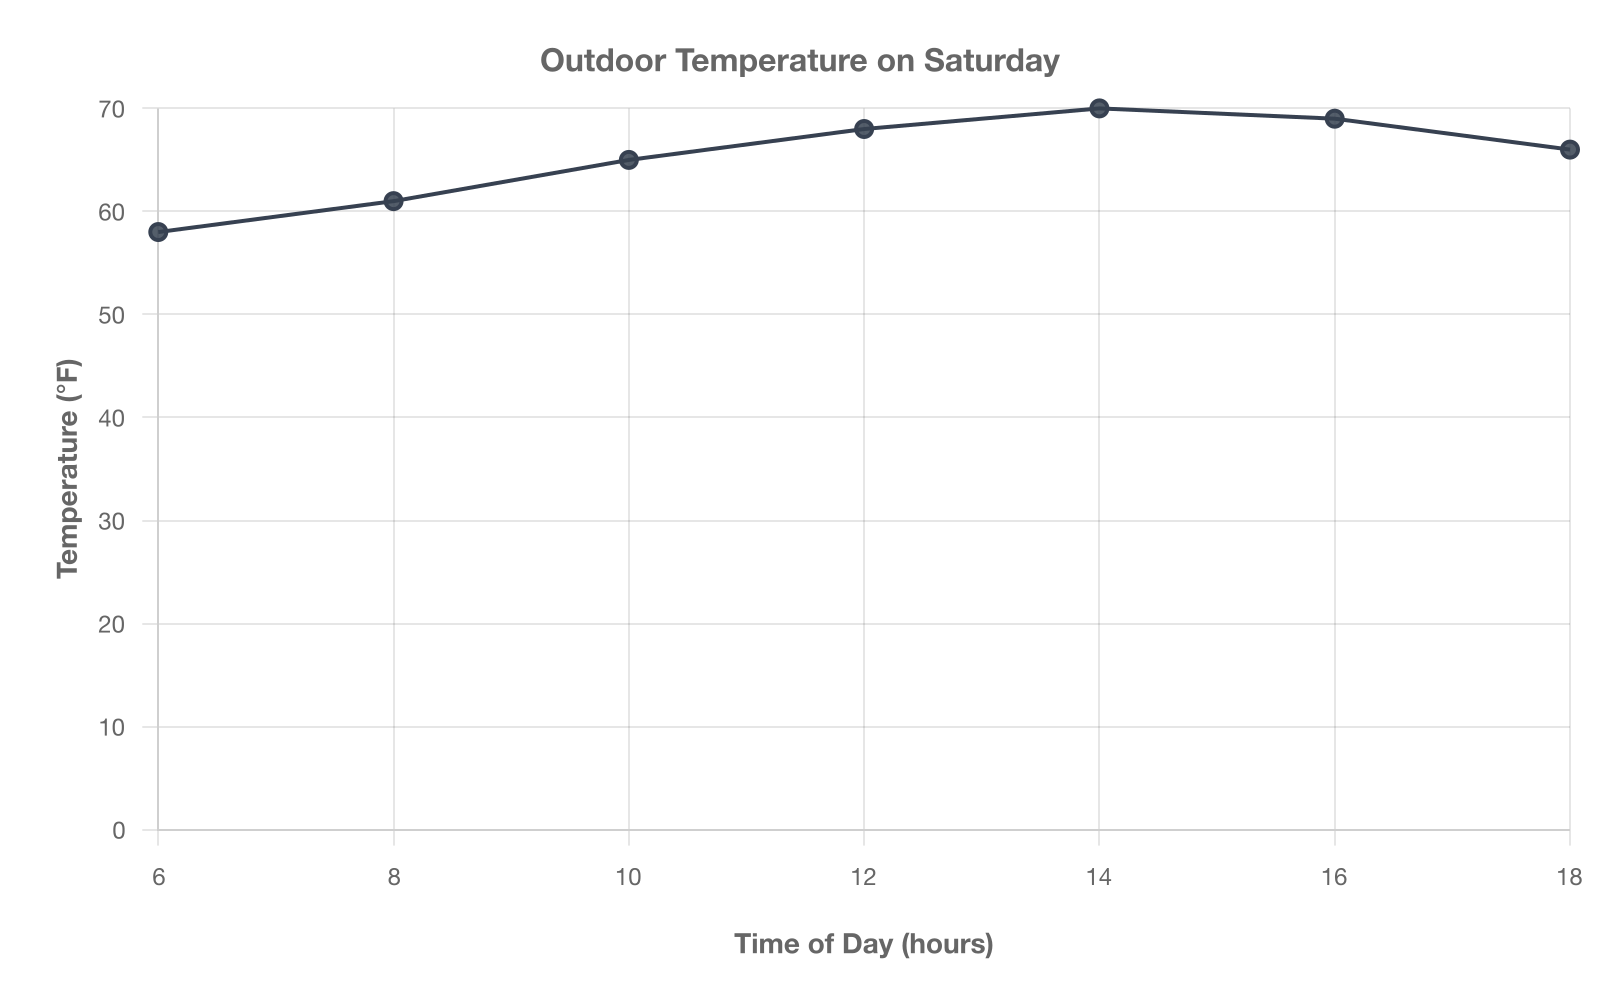
Refer to the graph. Between 8 a.m. and 2 p.m., what was the average rate of change of the temperature, in degrees Fahrenheit per hour?
$$0.75$$
$$3.0$$
$$1.5$$
$$1.2$$
Explanation
At 8 a.m. the graph shows $$61^{\circ}\text{F}$$, and at 2 p.m. (14:00) it shows $$70^{\circ}\text{F}$$. The change is $$70-61=9^{\circ}\text{F}$$ over $$14-8=6$$ hours, giving $$9/6=1.5^{\circ}\text{F per hour}$$.
A: $$0.75$$ misuses the total 12-hour span.
B: $$1.2$$ divides the 6-hour change by 7.5 hours in error.
D: $$3.0$$ confuses the change with the rate for a 3-hour interval.
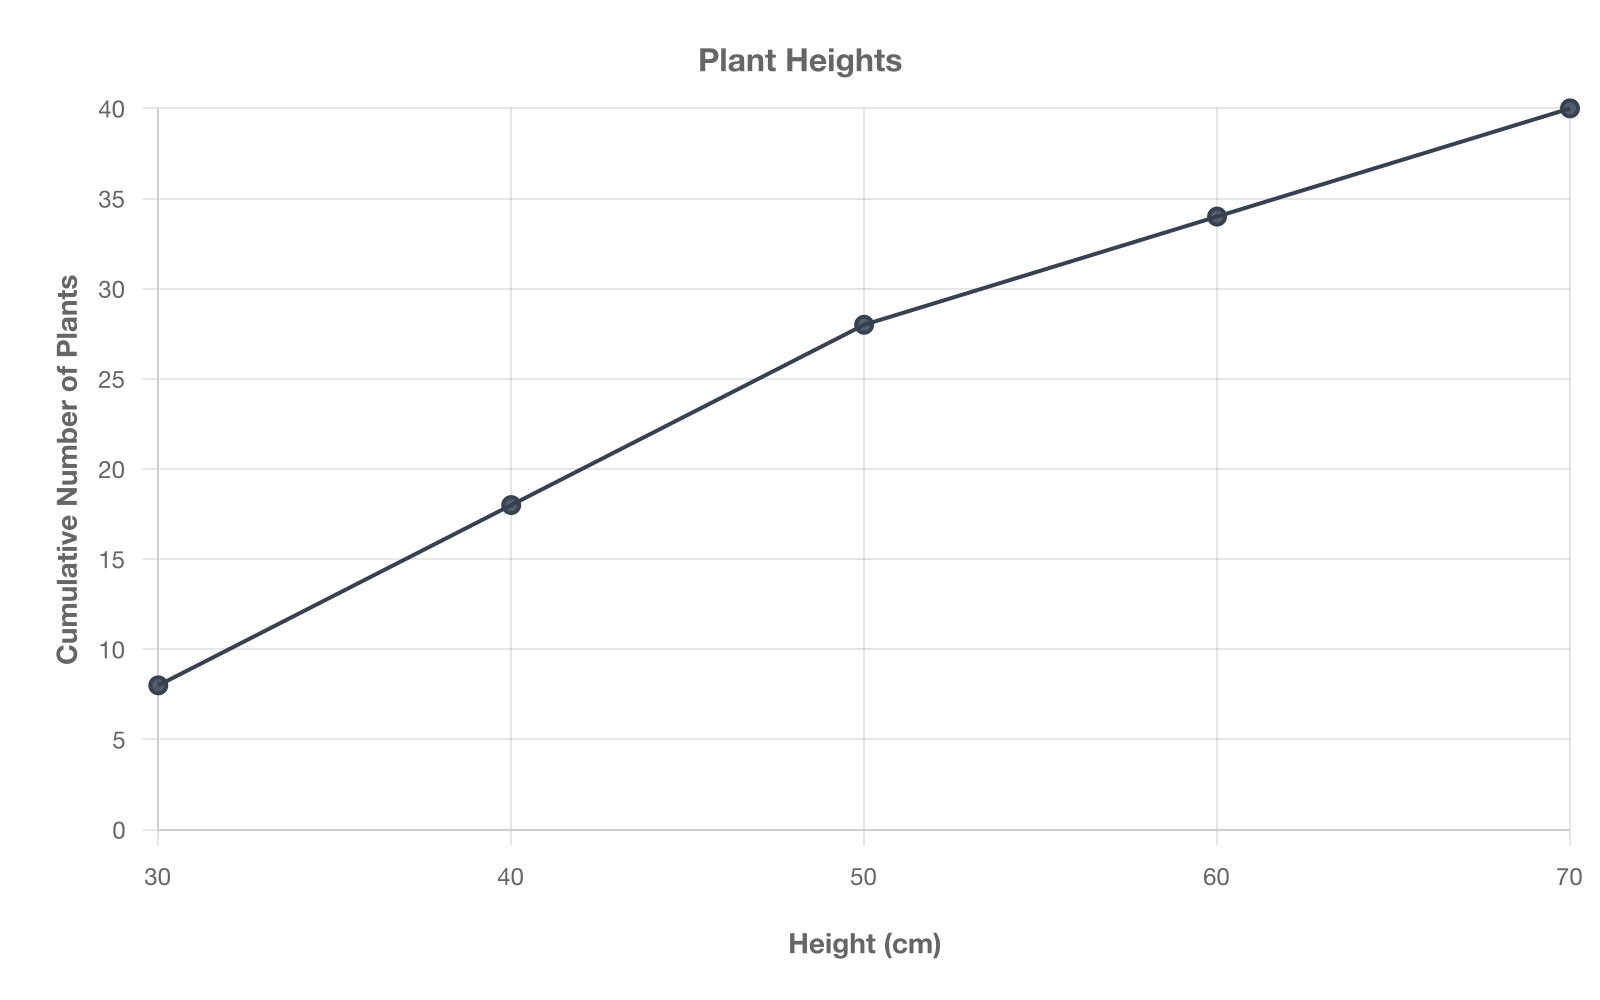
Based on the cumulative frequency graph, what percent of the 40 plants are taller than 50 cm?
35%
30%
40%
20%
Explanation
At 50 cm the graph shows 28 plants or 70 % at or below that height. Plants taller than 50 cm: $$40-28=12$$, which is $$12/40=30%$$.
Other choices misread the cumulative counts.
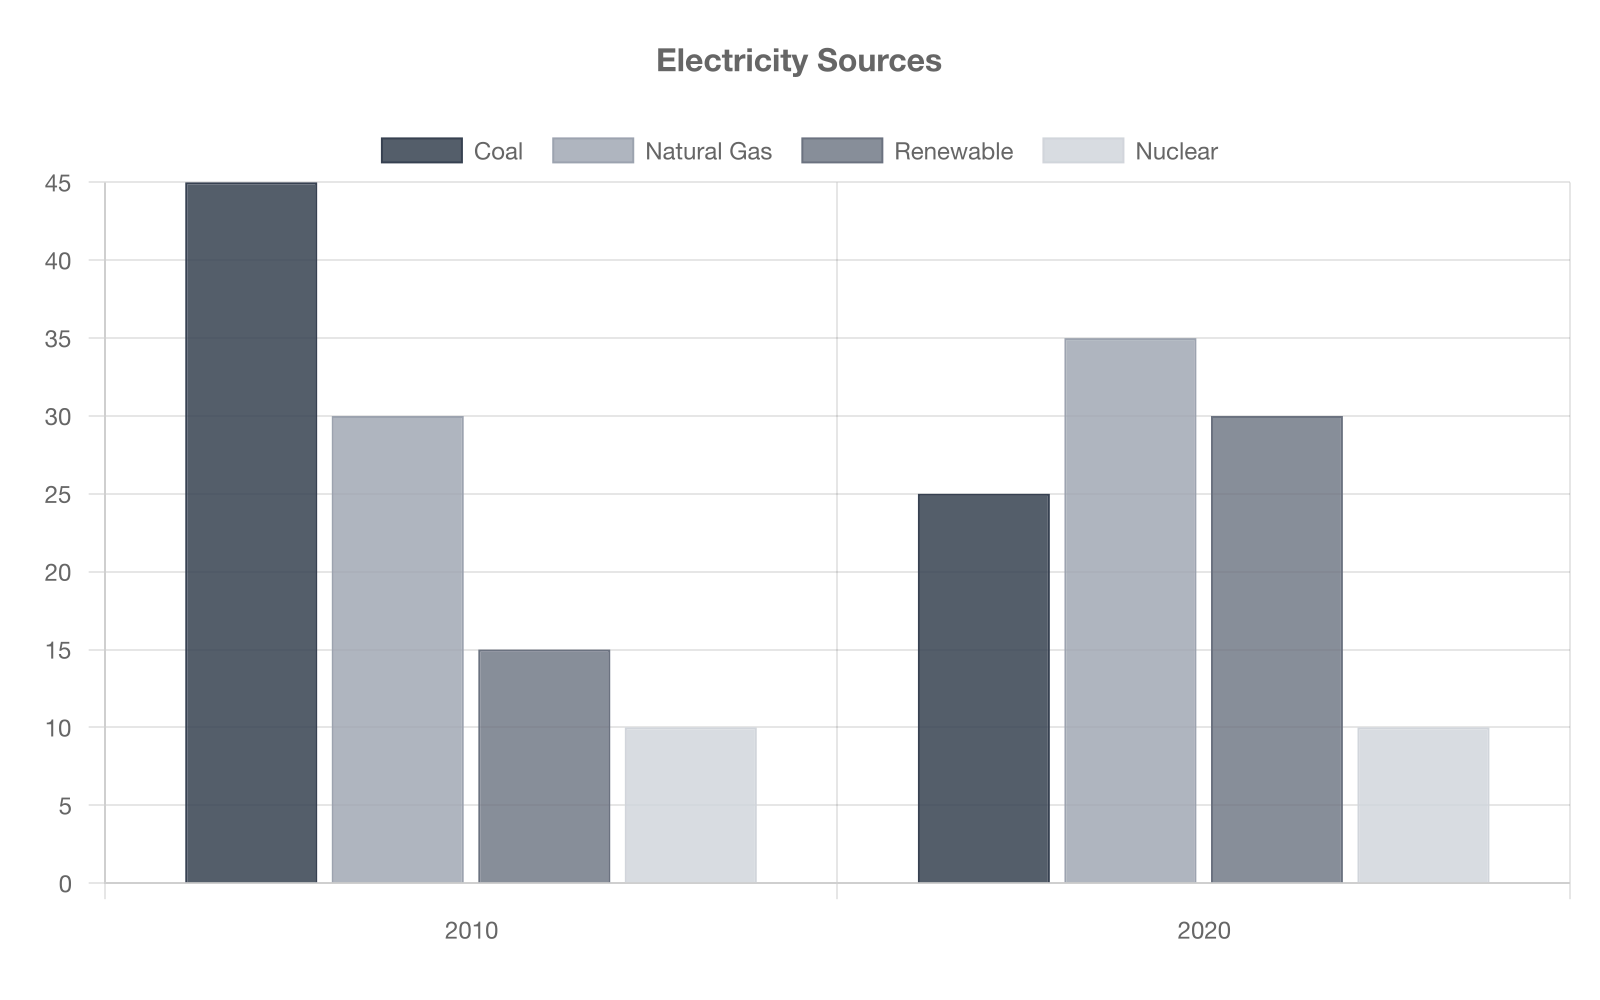
Refer to the stacked bar chart. Which energy source experienced the greatest change in its percentage share of electricity generation from 2010 to 2020?
Renewable
Coal
Natural gas
Nuclear
Explanation
Coal drops from 45 % to 25 %, a 20-percentage-point change. Renewable rises 15 → 30 (15 points), natural gas 30 → 35 (5), nuclear stays at 10 (0). The largest change is coal. Others change less.
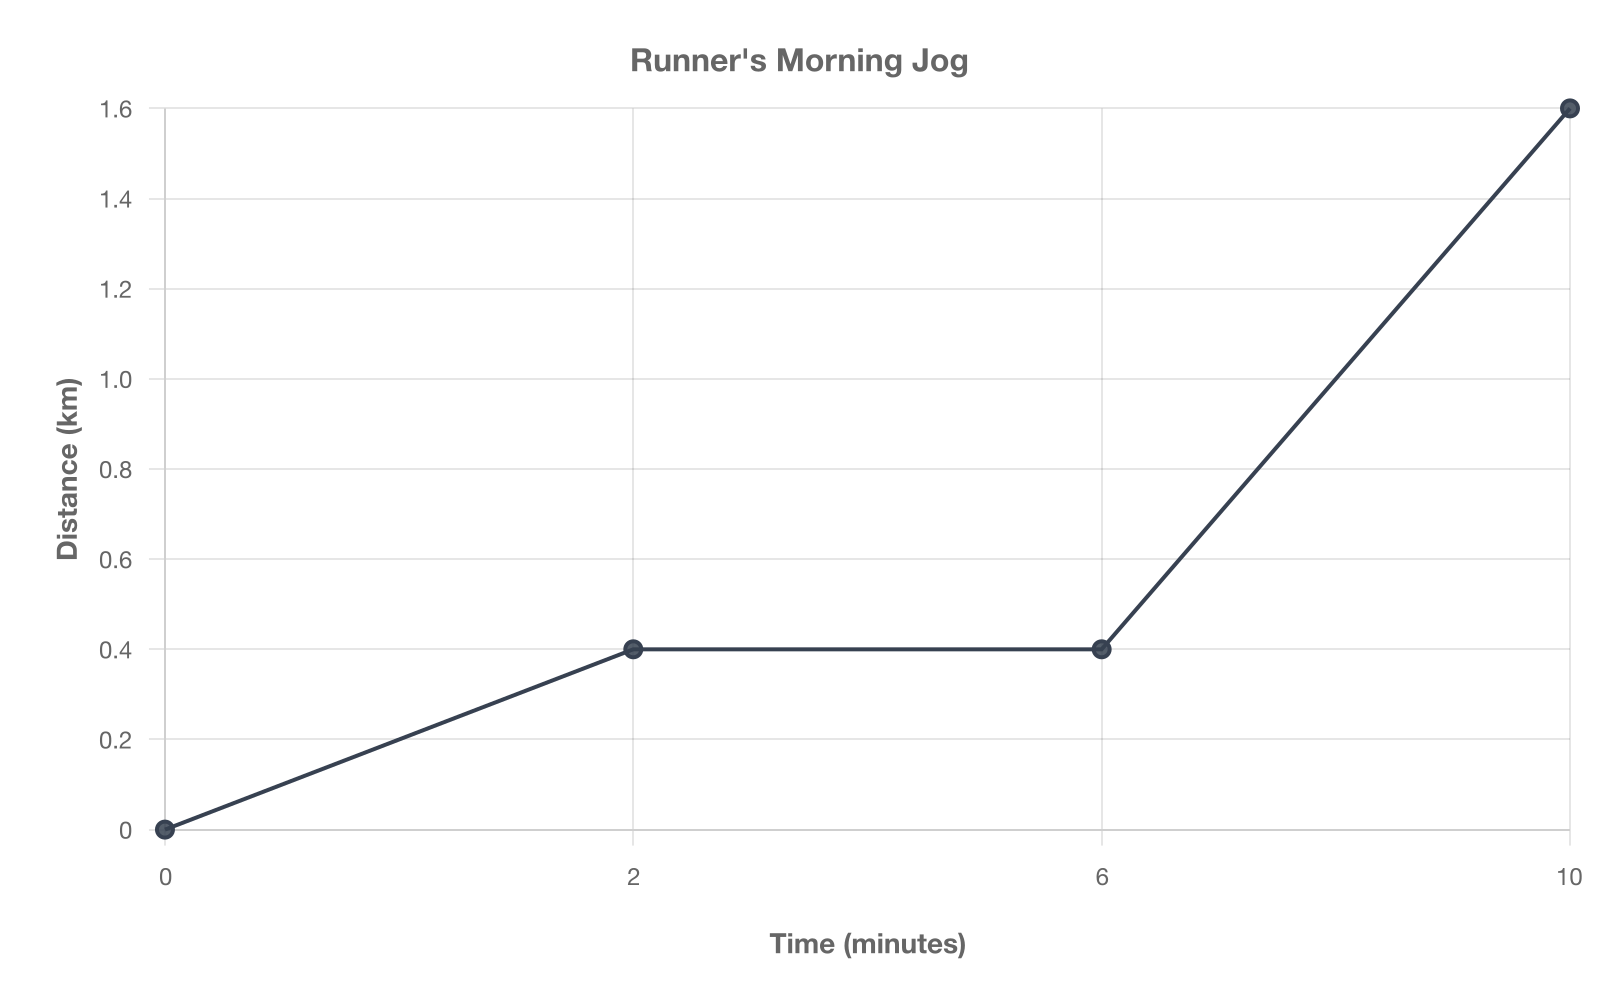
Use the distance–time graph. During which time interval was the runner at rest?
8–10 minutes
2–6 minutes
0–2 minutes
6–8 minutes
Explanation
The graph is horizontal from 2 to 6 minutes, showing no increase in distance. A, C, and D correspond to positive-slope segments indicating motion.
Use the bar graph to answer the question. Approximately what percent of the students going on the field trip are seniors (Grade 12)?
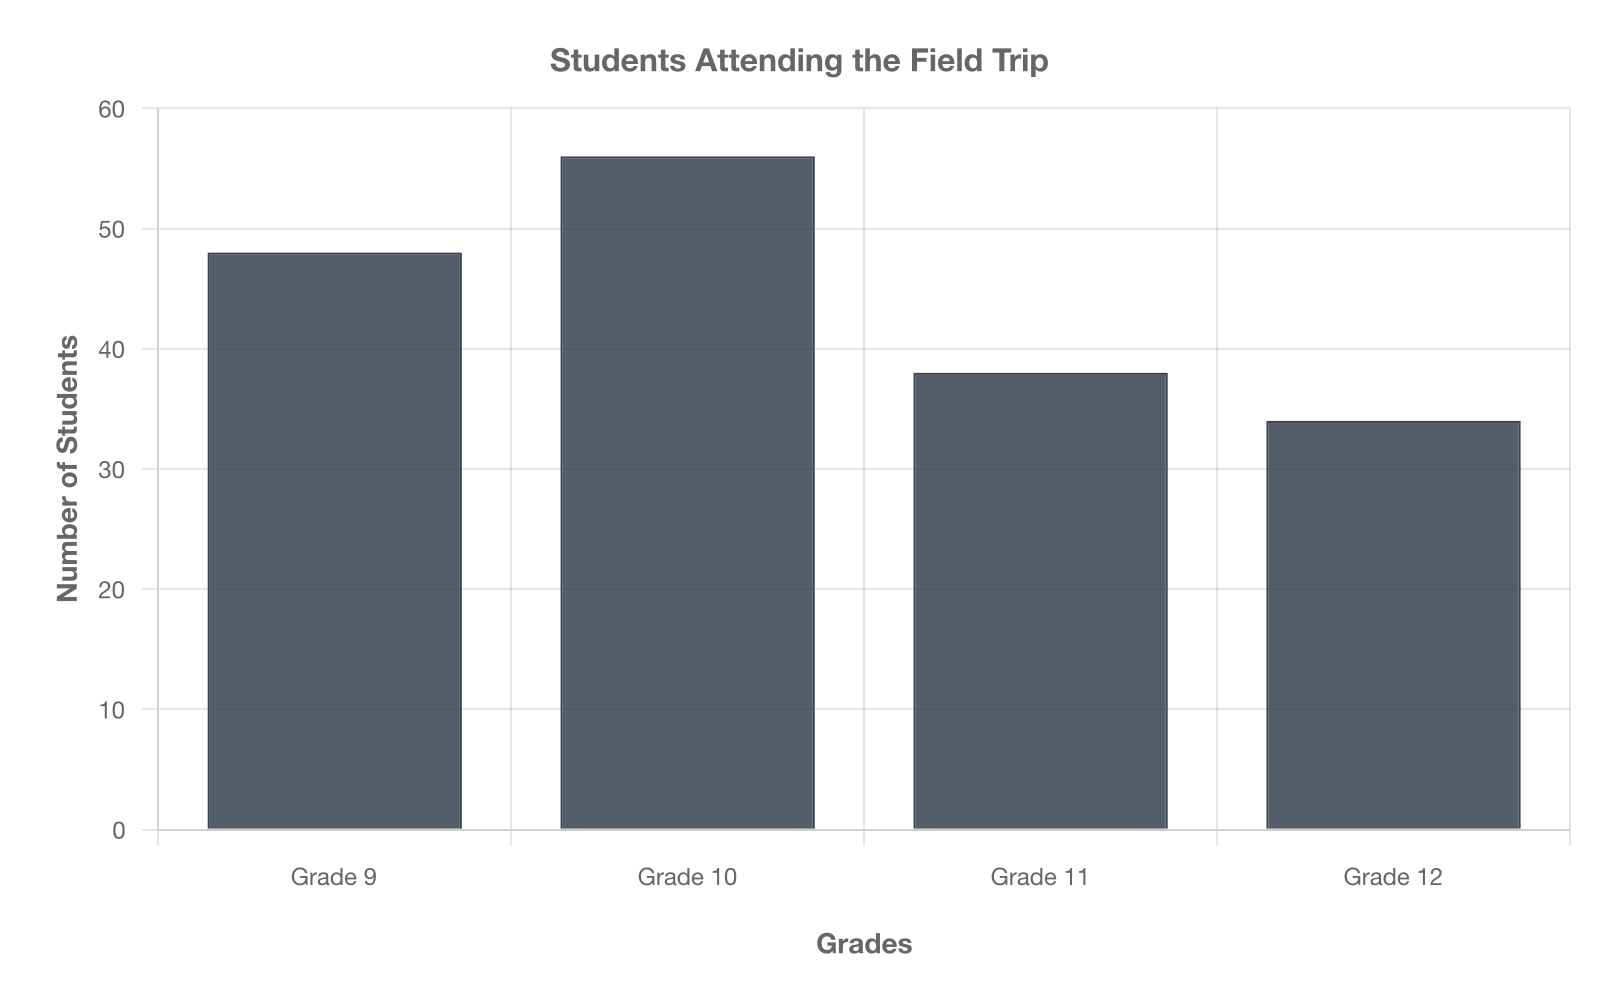
19%
32%
12%
25%
Explanation
Total students $$48+56+38+34=176$$. Seniors: $$34/176\approx0.193=19%$$.
A: 12 % uses 22 seniors.
C: 25 % rounds 34/136.
D: 32 % treats 56 seniors instead of 34.
Based on the double-line graph, in which year did sales of Product A first exceed those of Product B by at least $$\3$$ million?
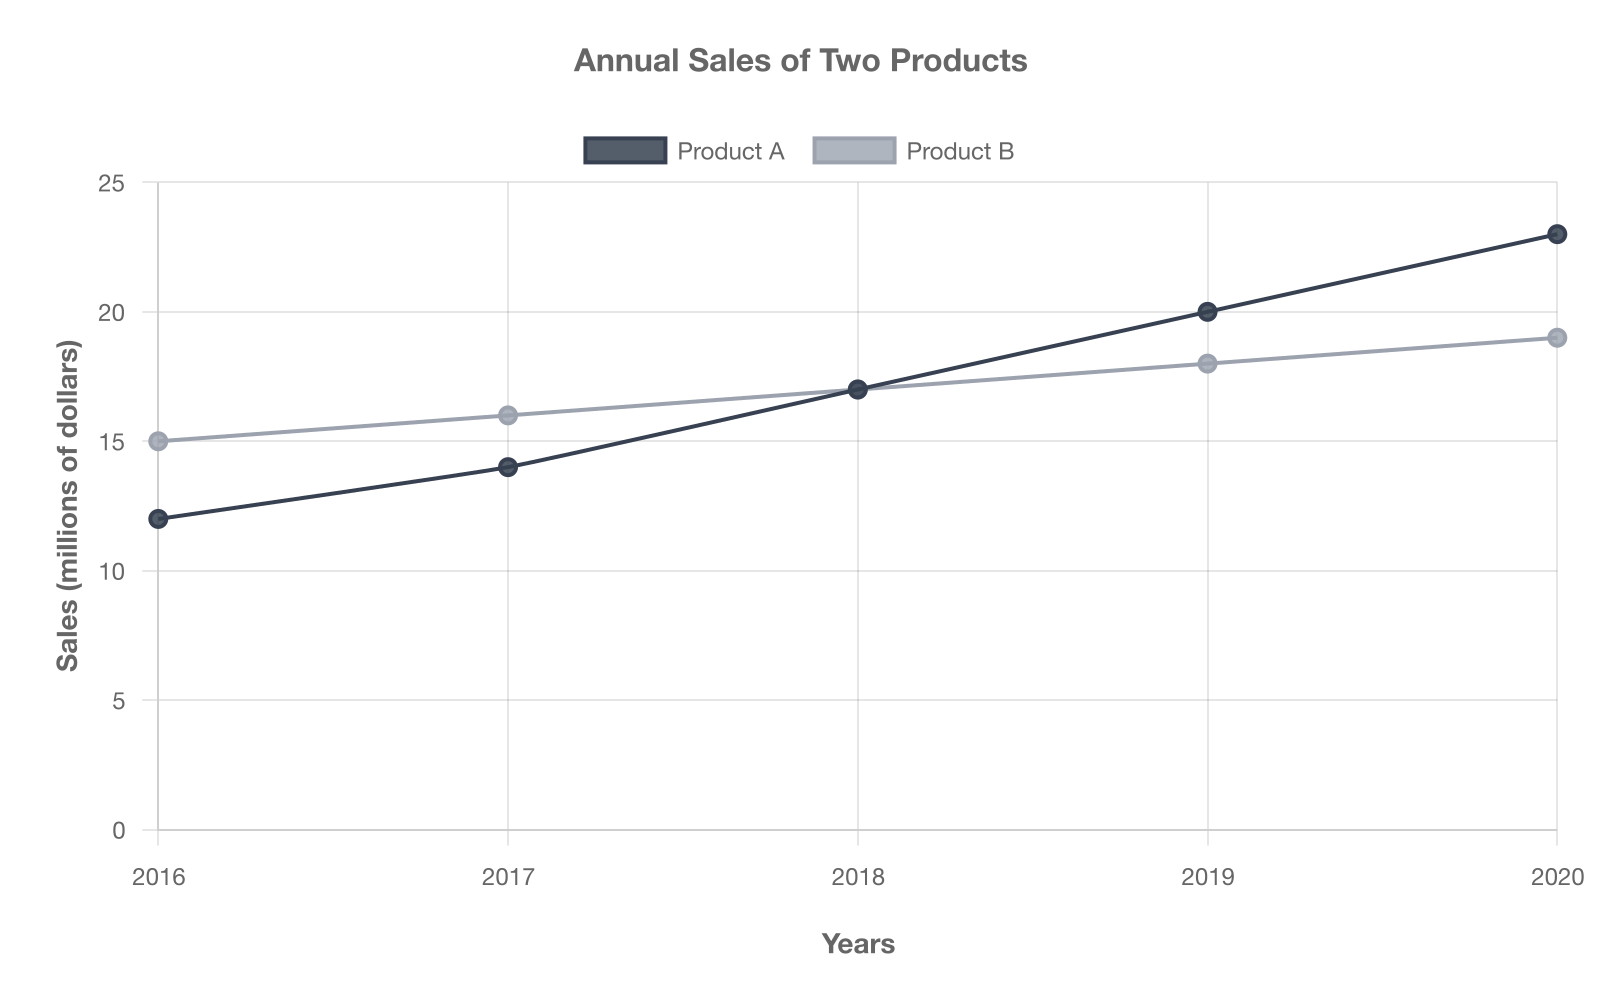
2017
2018
2019
2020
Explanation
Difference A − B by year: 2016 = $$-3$$, 2017 = $$-2$$, 2018 = $$0$$, 2019 = $$+2$$, 2020 = $$+4$$. The first year the gap reaches at least $$3$$ million is 2020. Earlier years fall short.
Refer to the histogram below. If one student is chosen at random, what is the probability that the student scored at least 80 on the test?
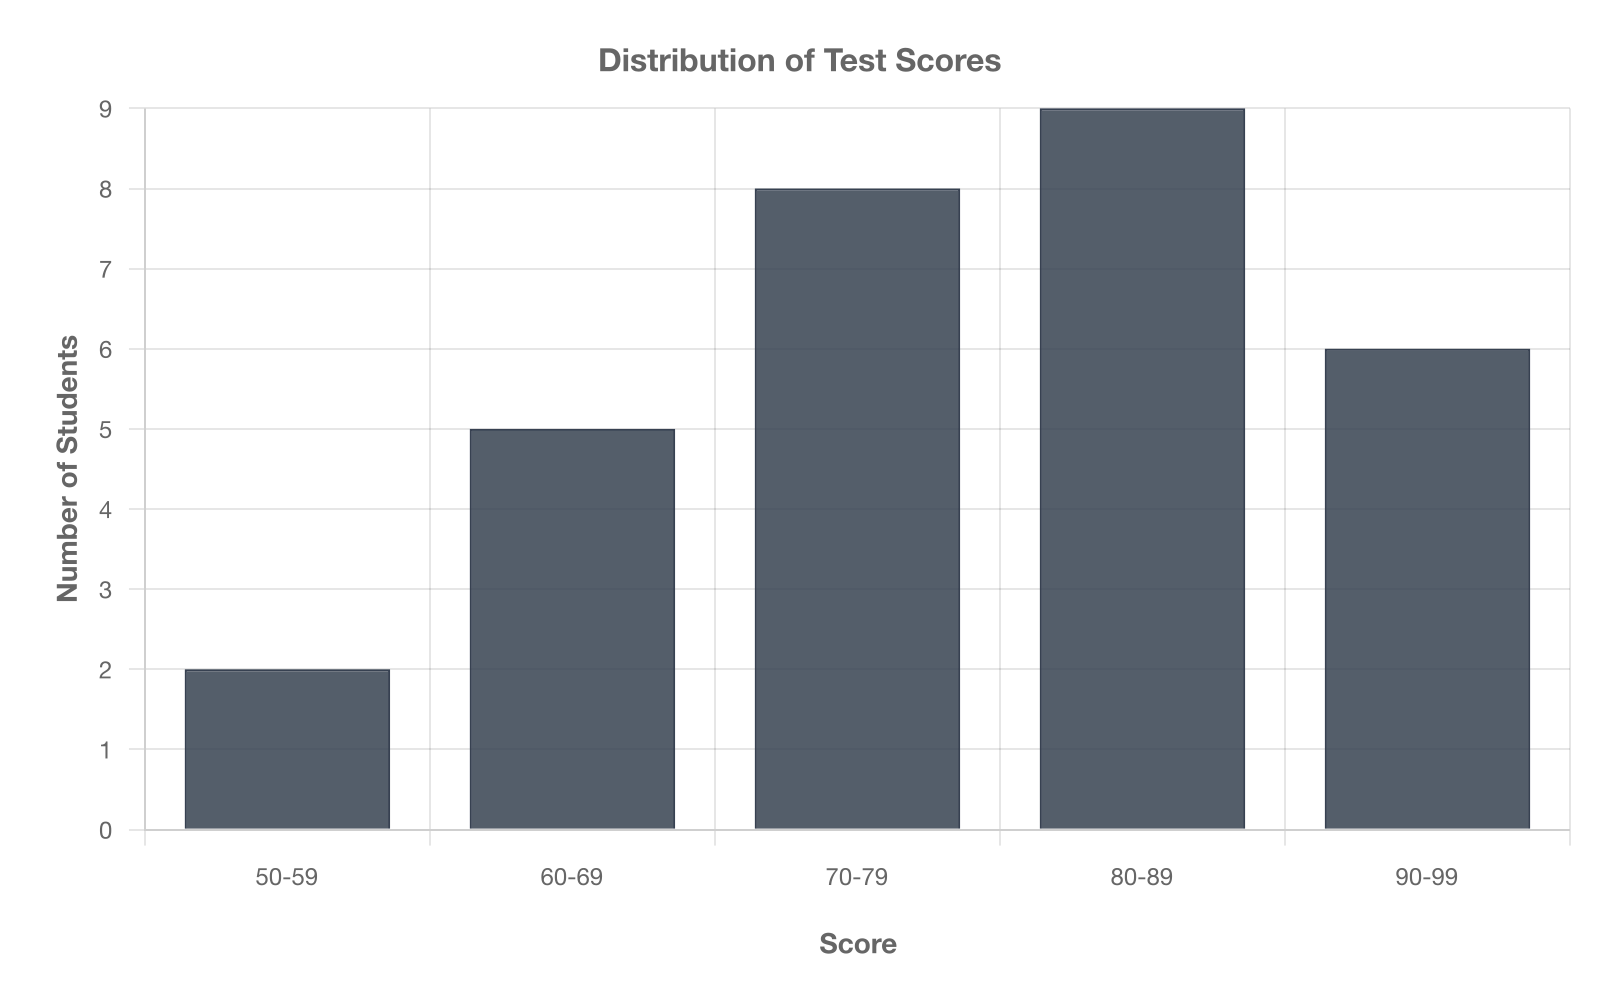
$$\dfrac12$$
$$\dfrac23$$
$$\dfrac13$$
$$\dfrac16$$
Explanation
Bars for 80–89 and 90–99 contain $$9+6=15$$ students. Total students: $$2+5+8+9+6=30$$. Probability $$=15/30=1/2$$.
A and B undervalue by using only one bar.
D assumes 20 students scored 80 or higher.
Use the box-and-whisker plot below. About what percent of the students studied between 6 and 12 hours inclusive during the week?
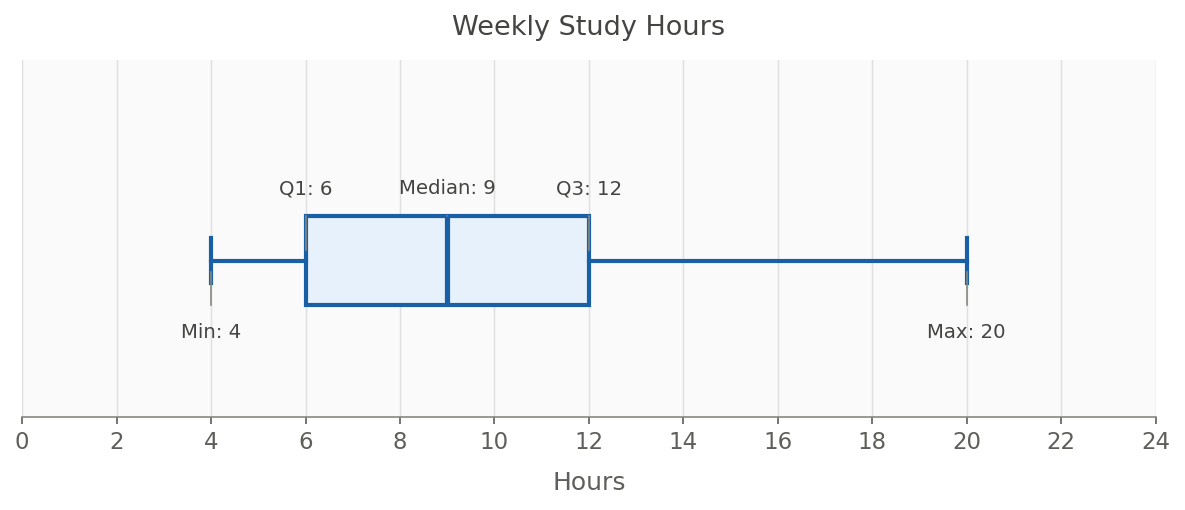
75%
25%
50%
Cannot be determined
Explanation
The interval from the first quartile (6 h) to the third quartile (12 h) contains the middle 50 % of the data.
A and C confuse quartile spacing.
D ignores the definition of a box plot.
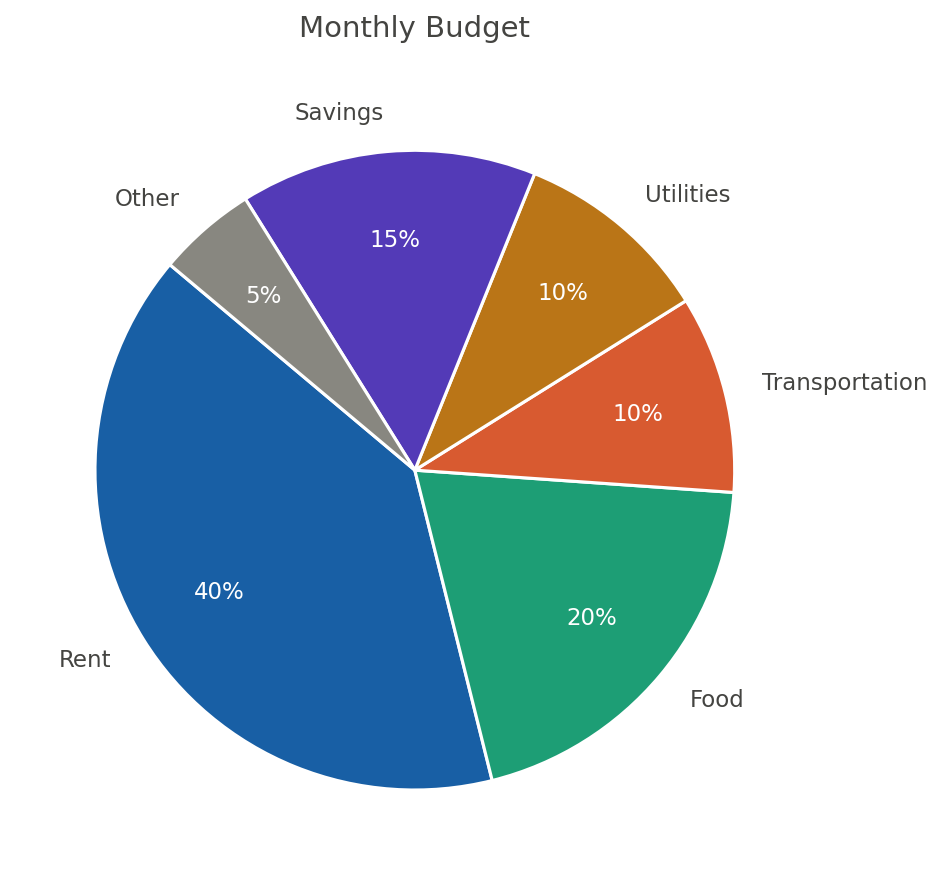
Look at the pie chart below. If the household’s monthly income is $$\3{,}200$$, about how many dollars are allocated to savings each month?
$$\560$$
$$\400$$
$$\320$$
$$\480$$
Explanation
The chart shows Savings = 15 %. $$0.15\times3,200=480$$. Others correspond to 10 %, 12.5 %, and 17.5 % slices, not the savings slice.