How to find the answer from a table - ISEE Middle Level Quantitative Reasoning
Card 0 of 250
The table below gives the number of students who scored in each of five ranges on a standardized test.

No student scored below  .
.
What percent of the students scored  or less (nearest whole percent)?
The table below gives the number of students who scored in each of five ranges on a standardized test.
No student scored below
What percent of the students scored
Add the students who finished in the bottom two ranges ( --
-- and
and  ):
):

Now add all the students from all five ranges:

To figure out what percent of all of the students finished in the bottom two ranges, calculate:

The correct choice is  .
.
Add the students who finished in the bottom two ranges (
Now add all the students from all five ranges:
To figure out what percent of all of the students finished in the bottom two ranges, calculate:
The correct choice is
Compare your answer with the correct one above
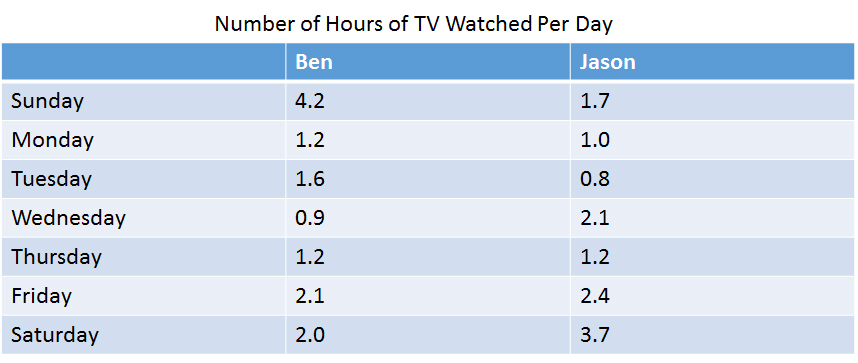
Consider the table. On which day of the week is the combined total of Ben and Jason's TV viewing the greatest?
Consider the table. On which day of the week is the combined total of Ben and Jason's TV viewing the greatest?
On Sundays, Ben and Jason watch a total of 5.9 hours of TV:

They watch less TV on all other days: On Saturdays they watch 5.7 hours, on Fridays they watch 4.5 hours, and on Thursdays they watch 2.4 hours.
On Sundays, Ben and Jason watch a total of 5.9 hours of TV:
They watch less TV on all other days: On Saturdays they watch 5.7 hours, on Fridays they watch 4.5 hours, and on Thursdays they watch 2.4 hours.
Compare your answer with the correct one above
Below is the list of candidates for Student Council president, along with the number of votes each won:

What percent of the students voted for Jarrow (nearest tenth)?
Below is the list of candidates for Student Council president, along with the number of votes each won:
What percent of the students voted for Jarrow (nearest tenth)?
 students total voted. Out of those, 29 voted for Jarrow. To convert this to a percent, use this proportion and solve for
  :
:


Compare your answer with the correct one above
Below is the list of candidates for Student Council president, along with the number of votes each won:

What percent of the votes (nearest whole number) were won by the third-place finisher?
Below is the list of candidates for Student Council president, along with the number of votes each won:
What percent of the votes (nearest whole number) were won by the third-place finisher?
Third place was won by Harris, who won 64 out of  votes. To rewrite this as a percent, solve this proportion statement for
  :
:


Third place was won by Harris, who won 64 out of
Compare your answer with the correct one above
The above circle graph shows the results of a school election. According to the rules, the election falls to the student who wins the majority of the votes; if no student wins a majority, the top two vote-getters will face each other in a runoff, with the winner being elected.
Which of the following is the result of this election?
Since each of the six portions of the graph takes up less than half, no one won a majority. Therefore, there will be a runoff. The two largest portions are light blue (Phelps) and orange (Creighton), so Phelps and Creighton got the most and second-most votes, and they will face each other in a runoff.
Since each of the six portions of the graph takes up less than half, no one won a majority. Therefore, there will be a runoff. The two largest portions are light blue (Phelps) and orange (Creighton), so Phelps and Creighton got the most and second-most votes, and they will face each other in a runoff.
Compare your answer with the correct one above
The above circle graph shows the results of a school election. According to the rules, the office of President falls to the student who wins the most votes, and the office of Vice-President falls to the student who finishes second. A runoff only happens in case of a tie.
Which of the following is the result of this election?
The two largest portions of the pie graph are light blue (Phelps) and orange (Creighton); Phelps got the most votes and Creighton got the second-most. Therefore, Phelps was elected President and Creighton was elected Vice-President - there will be no runoffs.
The two largest portions of the pie graph are light blue (Phelps) and orange (Creighton); Phelps got the most votes and Creighton got the second-most. Therefore, Phelps was elected President and Creighton was elected Vice-President - there will be no runoffs.
Compare your answer with the correct one above
The above circle graph shows the results of a school election. According to the rules, the office of President falls to the student who wins the most votes; the office of Vice-President falls to the student who finishes second; the office of Secretary-Treasurer falls to the student who finishes third. A runoff only happens in case of a tie.
Which candidate was elected Secretary-Treasurer?
The third-largest portion of the circle graph is gray, which, according to the legend, corresponds to Wells's share of the vote. Wells was elected Secretary-Treasurer outright.
The third-largest portion of the circle graph is gray, which, according to the legend, corresponds to Wells's share of the vote. Wells was elected Secretary-Treasurer outright.
Compare your answer with the correct one above
Below is a table that gives the population of Washington City for six census years.

Which of the following decades saw the greatest growth in the city's population?
Below is a table that gives the population of Washington City for six census years.
Which of the following decades saw the greatest growth in the city's population?
For each decade, take the difference of the population of the last year and that of the first year. We can omit 1990 to 2000, as the population declined over that decade.
1960-70: 
1970-80: 
1980-90: 
2000-10: 
The greatest growth occurred between 2000 and 2010.
For each decade, take the difference of the population of the last year and that of the first year. We can omit 1990 to 2000, as the population declined over that decade.
1960-70:
1970-80:
1980-90:
2000-10:
The greatest growth occurred between 2000 and 2010.
Compare your answer with the correct one above
Use the following table to answer the question.

How many students received an A in math?
Use the following table to answer the question.
How many students received an A in math?
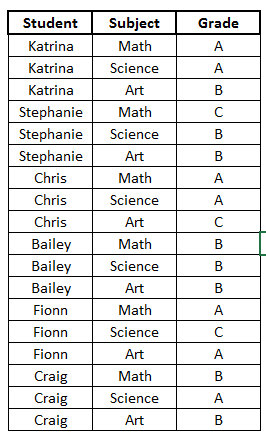
When looking at the table
we can see that is shows several students and within the subjects of Math, Science, and Art what grades those students received in those classes.
So, going over the table briefly, we can see the first student Katrina. We see for Math she received an A. For science, Katrina received an A. And for Art, Katrina got a B. We can read the table similarly for the remaining students.
Now, the question asks how many students received an A in math. So we will look through the table and locate Math. Once we locate Math, we will look at the grade that corresponds with it (In this example, we do not care about who the student is. We just care about the grade). So, we will count the number of A's we see matched up to the subject Math.
Once we do that, we see there are 3 students who received A's in Math (Katrina, Chris, and Fionn).
Compare your answer with the correct one above
Use the following table to answer the question.
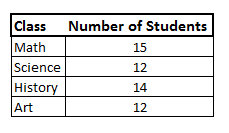
What is the total number of students in Math and History?
Use the following table to answer the question.
What is the total number of students in Math and History?
Let's look at the table.
we can see the first column is showing the different classes (Math, Science, History, and Art). The second column shows the number of students in each of those classes.
So, the question is asking how many total students are in Math and History. We will find the number of students in Math, and find the number of students in History, then add them together. So,
Compare your answer with the correct one above
Use the following table to answer the question.

What class did Craig have the highest grade in?
Use the following table to answer the question.
What class did Craig have the highest grade in?
Let's look at the table.
We can see the first column lists all the students. The next column shows all of the classes. And the last column shows the grade they received in those classes.
Now, to find which class Craig received the highest grade, we must first locate Craig. We can see all of Craig's classes are at the very bottom of the table.
Now, we will look at the grade he got in each class by following along the rows with Craig's name.
We can see Craig's first class is Math. He received a B.
Craig's second class is Science. He received an A.
Craig's third class is Art. He received a B.
Knowing this, we can see the highest grade Craig received was an A. The class where he received an A was Science.
Therefore, the class that Craig received the highest grade was Science.
Compare your answer with the correct one above
Use the following table to answer the question:
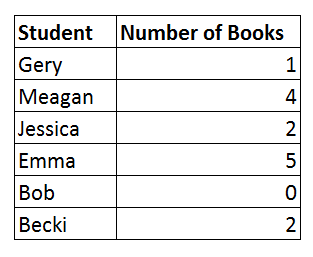
How many total books were borrowed by all of the students?
Use the following table to answer the question:
How many total books were borrowed by all of the students?
To answer the question, let's look at the table
We can see that the first column shows the students and the second column shows the number of books borrowed by each student.
We want to find the total number of books borrowed by all of the students. To answer this, we will simply add the number of books borrowed by each student. We get


Therefore, the total number of books borrowed by all of the students is  .
.
To answer the question, let's look at the table
We can see that the first column shows the students and the second column shows the number of books borrowed by each student.
We want to find the total number of books borrowed by all of the students. To answer this, we will simply add the number of books borrowed by each student. We get
Therefore, the total number of books borrowed by all of the students is
Compare your answer with the correct one above
Use the following table to answer the question:
Fill in the blank.
Use the following table to answer the question:
Fill in the blank.
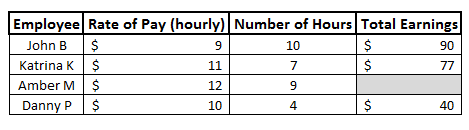
To answer the question, let's look at the table.
We can see the first column shows the employees. The next column shows their rate of pay, or how much money they make every hour. The next column shows how many hours they worked. And the last column shows their total earning.
So, to find their total earnings, we can see that we multiply the rate of pay by the number of hours.
Therefore, to fill in the blank, we will do the same for that row. We can see the rate of pay is $12. We also see that the number of hours worked is 9. Now, we will multiply the two numbers together to find the total earnings. We get

Therefore, to fill in the blank, we get  .
.
To answer the question, let's look at the table.
We can see the first column shows the employees. The next column shows their rate of pay, or how much money they make every hour. The next column shows how many hours they worked. And the last column shows their total earning.
So, to find their total earnings, we can see that we multiply the rate of pay by the number of hours.
Therefore, to fill in the blank, we will do the same for that row. We can see the rate of pay is $12. We also see that the number of hours worked is 9. Now, we will multiply the two numbers together to find the total earnings. We get
Therefore, to fill in the blank, we get
Compare your answer with the correct one above
Use the following table to answer the question:
What grade did Chris receive in Science?
Use the following table to answer the question:
What grade did Chris receive in Science?
To answer the question, let's look at the table.
We can see the first column shows the different students, the next column shows the classes they are in, and the last column shows their grade in the class.
Now, to find what grade Chris received in Science, we will first locate Chris' name in the first column.
Now, we can see his name appears 3 times. If we look to the right, we can see his name matches up to 3 different classes: Math, Science, and Art. We want to know his grade in Science, so we will choose that row.
We will again look to the right to see the grade. We can see that it says A.
Therefore, the grade that Chris received in Science was an A.
Compare your answer with the correct one above
Below is the list of candidates for Student Council president, along with the number of votes each won:
What percent of the students voted for Jarrow (nearest tenth)?
Below is the list of candidates for Student Council president, along with the number of votes each won:
What percent of the students voted for Jarrow (nearest tenth)?
students total voted. Out of those, 29 voted for Jarrow. To convert this to a percent, use this proportion and solve for :
Compare your answer with the correct one above
Choose the best answer from the four choices given.
Katie wants to buy as many umbrellas as she can to give to her friends as Christmas gifts. She finds a deal online where she can get umbrellas for $7 each or four umbrellas for $25 (including tax). If shipping is $3 for every $20 of merchandise (or portion thereof), how many umbrellas can she buy if she has $140?
The quickest way to solve this problem is by making a chart showing the units purchased and the total cost. Start with the 4-packs of umbrellas:
4-packs cost shipping cost total cost
1 $25 $6 $31
2 $50 $9 $59
3 $75 $12 $87
4 $100 $15 $115
5 $125 $21 $146 (too high)
Having determined that Katie can buy four of the 4-packs of umbrellas, now we see how many of the $7 individual umbrellas she can add to her order.
four 4-packs indiv. indiv. $ subtotal shipping $ total $
$100 1 $7 $107 $18 $125
$100 2 $14 $114 $18 $132
$100 3 $21 $121 $21 $142 (too high)
Therefore, Katie can buy (4) 4-packs and (2) individual umbrellas (18 total umbrellas) for $132.
ALTERNATIVELY, you can begin by determining the highest subtotal she can afford and work backwards from there. $120 is 6 x $20, so the shipping charge would be $6 x 3 = $18, for a total cost of $138. One more dollar on the subtotal would bring it into the next $20 segment, bringing the shipping charge up to $21 (and $142 is greater than $140). Thus, from here you could figure out the maximum number of $25 4-packs and $7 individual umbrellas Katie could buy with $120.


Since $6 is not enough to buy any umbrellas, the total would be
+2=18")
The quickest way to solve this problem is by making a chart showing the units purchased and the total cost. Start with the 4-packs of umbrellas:
4-packs cost shipping cost total cost
1 $25 $6 $31
2 $50 $9 $59
3 $75 $12 $87
4 $100 $15 $115
5 $125 $21 $146 (too high)
Having determined that Katie can buy four of the 4-packs of umbrellas, now we see how many of the $7 individual umbrellas she can add to her order.
four 4-packs indiv. indiv. $ subtotal shipping $ total $
$100 1 $7 $107 $18 $125
$100 2 $14 $114 $18 $132
$100 3 $21 $121 $21 $142 (too high)
Therefore, Katie can buy (4) 4-packs and (2) individual umbrellas (18 total umbrellas) for $132.
ALTERNATIVELY, you can begin by determining the highest subtotal she can afford and work backwards from there. $120 is 6 x $20, so the shipping charge would be $6 x 3 = $18, for a total cost of $138. One more dollar on the subtotal would bring it into the next $20 segment, bringing the shipping charge up to $21 (and $142 is greater than $140). Thus, from here you could figure out the maximum number of $25 4-packs and $7 individual umbrellas Katie could buy with $120.
Since $6 is not enough to buy any umbrellas, the total would be
Compare your answer with the correct one above
The table below gives the population of Buchanan City in each census year from 1930 to 1980.

Which is the greater quantity?
(a) The decline in the population of Buchanan City between 1940 and 1950
(b) The growth in the population of Buchanan City between 1950 and 1960
The table below gives the population of Buchanan City in each census year from 1930 to 1980.
Which is the greater quantity?
(a) The decline in the population of Buchanan City between 1940 and 1950
(b) The growth in the population of Buchanan City between 1950 and 1960
The population of Buchanan City in 1960 is greater than it was in 1940, so its decline between 1940 and 1950 must be less than its growth between 1950 and 1960.
The population of Buchanan City in 1960 is greater than it was in 1940, so its decline between 1940 and 1950 must be less than its growth between 1950 and 1960.
Compare your answer with the correct one above
The table below gives the population of Buchanan City in each census year from 1930 to 1980.

Which is the greater quantity?
(a) The population of Buchanan City in 1965
(b) The population of Buchanan City in 1975
The table below gives the population of Buchanan City in each census year from 1930 to 1980.
Which is the greater quantity?
(a) The population of Buchanan City in 1965
(b) The population of Buchanan City in 1975
No information about the population of Buchanan City is given for either 1965 or 1975.
No information about the population of Buchanan City is given for either 1965 or 1975.
Compare your answer with the correct one above
The table below gives the population of Buchanan City in each census year from 1930 to 1980.

Which is the greater quantity?
(a) The growth in the population of Buchanan City between 1930 and 1940
(b) The growth in the population of Buchanan City between 1950 and 1960
The table below gives the population of Buchanan City in each census year from 1930 to 1980.
Which is the greater quantity?
(a) The growth in the population of Buchanan City between 1930 and 1940
(b) The growth in the population of Buchanan City between 1950 and 1960
(a) Between 1930 and 1940, the population grew by 
(b) Between 1950 and 1960, the population grew by  .
.
This makes (b) greater
(a) Between 1930 and 1940, the population grew by
(b) Between 1950 and 1960, the population grew by
This makes (b) greater
Compare your answer with the correct one above
The table below gives the population of Buchanan City in each census year from 1930 to 1980.

The population figures are not available for 1990, 2000, or 2010, but it is known that the population has increased by at least 300 over each ten-year period since 1980.
Which is the greater quantity?
(a) The population of Buchanan City in 2010
(b) 
The table below gives the population of Buchanan City in each census year from 1930 to 1980.
The population figures are not available for 1990, 2000, or 2010, but it is known that the population has increased by at least 300 over each ten-year period since 1980.
Which is the greater quantity?
(a) The population of Buchanan City in 2010
(b)
Since the population of Buchanan City increased by at least 300 over each of three decades since 1980, then the population in 2010 is at least
 .
.
Since the population of Buchanan City increased by at least 300 over each of three decades since 1980, then the population in 2010 is at least
Compare your answer with the correct one above