Geometry - ISEE Lower Level Quantitative Reasoning
Card 0 of 5385
A coordinate plane is shown.
Ralph plotted the following points on the coordinate grid:
Point W (2, 4); Point X (3, 6); Point Y (5, 4); Point Z (6, 6)
A polygon is formed with vertices W, X, Y, and Z. Which type of polygon is formed?
A coordinate plane is shown.
Ralph plotted the following points on the coordinate grid:
Point W (2, 4); Point X (3, 6); Point Y (5, 4); Point Z (6, 6)
A polygon is formed with vertices W, X, Y, and Z. Which type of polygon is formed?
Begin by plotting the points and connecting the vertices.
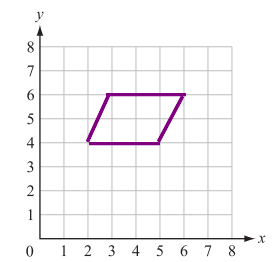
The quadrilateral that is created has two sets of parallel sides. Out of the possible answer choices, this can describe both squares and parallelograms. Because the figure does not contain right angles and the sides are not all the same length, it must be a parallelogram.
Begin by plotting the points and connecting the vertices.
The quadrilateral that is created has two sets of parallel sides. Out of the possible answer choices, this can describe both squares and parallelograms. Because the figure does not contain right angles and the sides are not all the same length, it must be a parallelogram.
Compare your answer with the correct one above
A coordinate plane is shown.
Ralph plotted the following points on the coordinate grid:
Point W (1, 1); Point X (7, 3); Point Y (1, 6); Point Z (7, 8)
A polygon is formed with vertices W, X, Y, and Z. Which type of polygon is formed?
A coordinate plane is shown.
Ralph plotted the following points on the coordinate grid:
Point W (1, 1); Point X (7, 3); Point Y (1, 6); Point Z (7, 8)
A polygon is formed with vertices W, X, Y, and Z. Which type of polygon is formed?
Begin by plotting and connecting the vertices.
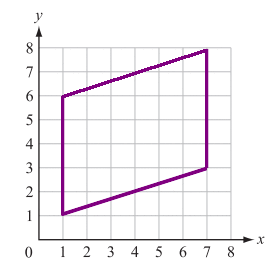
The quadrilateral that is created has two sets of parallel sides. Out of the possible answer choices, this can describe both rhombuses and parallelograms. Because the sides are not all the same length, it must be a parallelogram.
Begin by plotting and connecting the vertices.
The quadrilateral that is created has two sets of parallel sides. Out of the possible answer choices, this can describe both rhombuses and parallelograms. Because the sides are not all the same length, it must be a parallelogram.
Compare your answer with the correct one above
A square has an area of  . What is the length of one side?
A square has an area of
You can find the area of a square by multiplying two sides together. All of the sides of a square are equal. In this case,  , so the length of all of the sides of the square is 4 inches.
You can find the area of a square by multiplying two sides together. All of the sides of a square are equal. In this case,
Compare your answer with the correct one above
What is the area of a square if one side of the square is 6?
What is the area of a square if one side of the square is 6?
If one side of a square is 6, then each of the four sides of the square are equal to 6. To find the area of a square, we multiply the length and the height together. The length is 6, and the height is 6, thus the equation we use is  .
.
Remember the formula for the area of a quadrilateral is  . For a square, one side is equal to both the length and the width.
If one side of a square is 6, then each of the four sides of the square are equal to 6. To find the area of a square, we multiply the length and the height together. The length is 6, and the height is 6, thus the equation we use is
Remember the formula for the area of a quadrilateral is
Compare your answer with the correct one above
A right triangle has a base of  and a height of
  .
.
What is the area of the rectangle made by 2 of these triangles aligned along the hypotenuse?
A right triangle has a base of
What is the area of the rectangle made by 2 of these triangles aligned along the hypotenuse?
If one combines the 2 identical triangles, their base and height become the length and width of the rectangle.
Area of a rectangle is:

In this case

If one combines the 2 identical triangles, their base and height become the length and width of the rectangle.
Area of a rectangle is:
In this case
Compare your answer with the correct one above
If the area of a square is  , what is the length of each side?
If the area of a square is
To find the area of a square, the length must be multiplied by the height. Since a square has four equal sides, the length and width will have the same measurement. We must, therefore, find the square root of  . Since
  ,
,  is the square root of
  , which makes it the measurement for both the length and the width of the square.
To find the area of a square, the length must be multiplied by the height. Since a square has four equal sides, the length and width will have the same measurement. We must, therefore, find the square root of
Compare your answer with the correct one above
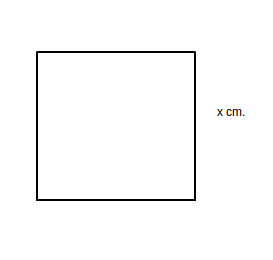
One side of a square is  centimeters long. What is the area of the square?
One side of a square is
The formula for finding the area of a square is  , or, because this is a square,
  .
.
area =  centimeters
  centimeters, or
The formula for finding the area of a square is
area =
Compare your answer with the correct one above
James found the area of the square below to be 36 centimeters squared.
What is the length of one side of the square?
James found the area of the square below to be 36 centimeters squared.
What is the length of one side of the square?
The area of a square can be found by multiplying the length of a side by itself. 36 is equal to 6 times 6, therefore the length of one side is 6 centimeters.
The area of a square can be found by multiplying the length of a side by itself. 36 is equal to 6 times 6, therefore the length of one side is 6 centimeters.
Compare your answer with the correct one above
Michaela drew th square below.
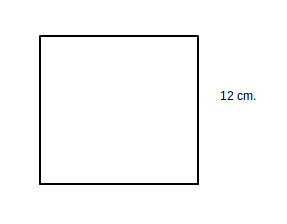
What is the area of the square?
Michaela drew th square below.
What is the area of the square?
The area of a square can be found by multiplying the length of a side times itself. The side length of the above square is 12 cm. By finding 12 x 12, we find that the area of the square is 144 cm. squared.
The area of a square can be found by multiplying the length of a side times itself. The side length of the above square is 12 cm. By finding 12 x 12, we find that the area of the square is 144 cm. squared.
Compare your answer with the correct one above
Daphne found the area of the square below to be 81 centimeters squared.
What is the length of one side of the square?
Daphne found the area of the square below to be 81 centimeters squared.
What is the length of one side of the square?
The area of a square can be found by multiplying the length of a side by itself. 81 is equal to 9 times 9, therefore the length of one side is 9 centimeters.
The area of a square can be found by multiplying the length of a side by itself. 81 is equal to 9 times 9, therefore the length of one side is 9 centimeters.
Compare your answer with the correct one above
What is the area of a parallelogram with a height of  inches and a base of
  inches?
What is the area of a parallelogram with a height of
The formula for finding the area of a parallelogram is the same as that of finding the area of a rectangle:

In this case, the area equals  inches times
  inches, or
  .
.
The formula for finding the area of a parallelogram is the same as that of finding the area of a rectangle:
In this case, the area equals
Compare your answer with the correct one above
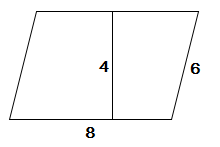
Ted drew the parallelogram shown below.
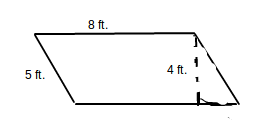
What is the area of the parallelogram?
Ted drew the parallelogram shown below.
What is the area of the parallelogram?
The area of a parallelogram can be found by multiplying the base times the height. The height is the perpendicular distance between two bases. In the above parallelogram, the base is 8 and its height is 4, giving the equation 8 x 4 = A. The area is 32 square feet.
The area of a parallelogram can be found by multiplying the base times the height. The height is the perpendicular distance between two bases. In the above parallelogram, the base is 8 and its height is 4, giving the equation 8 x 4 = A. The area is 32 square feet.
Compare your answer with the correct one above
Wilhelmina drew the parallelogram below.
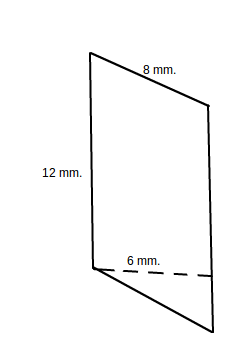
What is the area of the parallelogram?
Wilhelmina drew the parallelogram below.
What is the area of the parallelogram?
The area of a parallelogram can be found by multiplying the base times the height. The height is the perpendicular distance between two bases. In the above parallelogram, the base is 12 and its height is 6, giving the equation 12 x 6 = A. The area is 72 square millimeters.
The area of a parallelogram can be found by multiplying the base times the height. The height is the perpendicular distance between two bases. In the above parallelogram, the base is 12 and its height is 6, giving the equation 12 x 6 = A. The area is 72 square millimeters.
Compare your answer with the correct one above
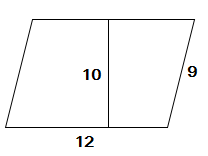
Find the area of the following parallelogram.
Find the area of the following parallelogram.
In order to find the area of a parallelogram we use the equation 
In this case our values are 
So, our area is: 
In order to find the area of a parallelogram we use the equation
In this case our values are
So, our area is:
Compare your answer with the correct one above
Find the area of the following parallelogram.
Find the area of the following parallelogram.
The equation for the area of a parallelogram is  .
.
In this case, our values are 
so, the area is: 
The equation for the area of a parallelogram is
In this case, our values are
so, the area is:
Compare your answer with the correct one above
What is the length of a rectangular room with an area of  and a width of
What is the length of a rectangular room with an area of

We have the area and the width, so we can plug those values into our equation and solve for our unknown.


We have the area and the width, so we can plug those values into our equation and solve for our unknown.
Compare your answer with the correct one above