Normal Distribution - AP Statistics
Card 0 of 72
Which of the following populations has a precisely normal distribution?
Which of the following populations has a precisely normal distribution?
Tap to see back →
A normal distribution is one in which the values are evenly distributed both above and below the mean. A population has a precisely normal distribution if the mean, mode, and median are all equal. For the population of 3,4,5,5,5,6,7, the mean, mode, and median are all 5.
A normal distribution is one in which the values are evenly distributed both above and below the mean. A population has a precisely normal distribution if the mean, mode, and median are all equal. For the population of 3,4,5,5,5,6,7, the mean, mode, and median are all 5.
If a population has a normal distribution, the number of values within one positive standard deviation of the mean will be . . .
If a population has a normal distribution, the number of values within one positive standard deviation of the mean will be . . .
Tap to see back →
In a normal distribution, the number of values within one positive standard deviation of the mean is equal to the number of values within one negative standard deviation of the mean. The reason for this is that the values below the population mean exactly parallel the values above the mean.
In a normal distribution, the number of values within one positive standard deviation of the mean is equal to the number of values within one negative standard deviation of the mean. The reason for this is that the values below the population mean exactly parallel the values above the mean.
Which is the following is true about the standard normal distribution?
Which is the following is true about the standard normal distribution?
Tap to see back →
The standard normal distribution is just like any other normal distribution that you might have looked at except that it has a standard deviation of 1 and a mean of 0.
The standard normal distribution is just like any other normal distribution that you might have looked at except that it has a standard deviation of 1 and a mean of 0.
Cheyenne is worried about food thieves in the break room at work, and she believes that, as the week progresses, and people get lazy and ready for the weekend, more food theft occurs. She gathered the following data on number of thefts per day, and fell very behind in her work for a week.
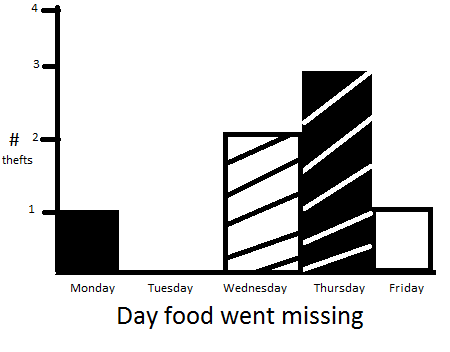
Which of the following statements about the data are true?
i: the data is normally distributed
ii: the data is skewed left
iii: the data supports Cheyenne's theory
iv: the data is a representative sample
Cheyenne is worried about food thieves in the break room at work, and she believes that, as the week progresses, and people get lazy and ready for the weekend, more food theft occurs. She gathered the following data on number of thefts per day, and fell very behind in her work for a week.
Which of the following statements about the data are true?
i: the data is normally distributed
ii: the data is skewed left
iii: the data supports Cheyenne's theory
iv: the data is a representative sample
Tap to see back →
The data is not normal by virtue of being skewed left, which also supports Cheyenne's theory... there is no way of knowing wether this data was a representative sample, but also no option with ii, iii and iv was provided to avoid frustration/confusion
The data is not normal by virtue of being skewed left, which also supports Cheyenne's theory... there is no way of knowing wether this data was a representative sample, but also no option with ii, iii and iv was provided to avoid frustration/confusion
Alex took a test in physics and scored a 35. The class average was 27 and the standard deviation was 5.
Noah took a chemistry test and scored an 82. The class average was 70 and the standard deviation was 8.
Show that Alex had the better performance by calculating -
-
Alex's standard normal percentile and
-
Noah's standard normal percentile
Tap to see back →
Alex -
/5 = 1.6 = .945") on the z-table
on the z-table
Noah -
/8=1.5=.933") on the z-table
on the z-table
Alex -
Noah -
Find the area under the standard normal curve between Z=1.5 and Z=2.4.
Find the area under the standard normal curve between Z=1.5 and Z=2.4.
Tap to see back →


Which parameters define the normal distribution?
Which parameters define the normal distribution?
Tap to see back →
The two main parameters of the normal distribution are  and
and  .
.  is a location parameter which determines the location of the peak of the normal distribution on the real number line.
  is a scale parameter which determines the concentration of the density around the mean. Larger
  's lead the normal to spread out more than smaller
  's.
's.
The two main parameters of the normal distribution are
In order to be considered a normal distribution, a data set (when graphed) must follow a bell-shaped symmetrical curve centered around the mean.
It must also adhere to the empirical rule that indicates the percentage of the data set that falls within (plus or minus) 1, 2 and 3 standard deviations of the mean.
In order to be a normal distribution, what percentage of the data set must fall within:
-

-

-

In order to be considered a normal distribution, a data set (when graphed) must follow a bell-shaped symmetrical curve centered around the mean.
It must also adhere to the empirical rule that indicates the percentage of the data set that falls within (plus or minus) 1, 2 and 3 standard deviations of the mean.
In order to be a normal distribution, what percentage of the data set must fall within:
Tap to see back →
- Percentile for Z=1 is .8413 - or - .1587 in one tail - or - .3174 in both tails -
1 - .3174=.6826
- Percentile for Z=2 is .9772 - or - .0228 in one tail - or - .0456 in both tails -
1 - .0456=.9544
- Percentile for Z=3 is .9987 - or - .0013 in one tail - or - .0026 in both tails -
1 - .0026=.9974
- Percentile for Z=1 is .8413 - or - .1587 in one tail - or - .3174 in both tails -
1 - .3174=.6826
- Percentile for Z=2 is .9772 - or - .0228 in one tail - or - .0456 in both tails -
1 - .0456=.9544
- Percentile for Z=3 is .9987 - or - .0013 in one tail - or - .0026 in both tails -
1 - .0026=.9974
All normal distributions can be described by two parameters: the mean and the variance. Which parameter determines the location of the distribution on the real number line?
All normal distributions can be described by two parameters: the mean and the variance. Which parameter determines the location of the distribution on the real number line?
Tap to see back →
The mean determines where the normal distribution lies on the real number line, while the variance determines the spread of the distribution.
The mean determines where the normal distribution lies on the real number line, while the variance determines the spread of the distribution.
Consider a normal distribution with a mean of  and a standard deviation of
  . Which of the following statements are true according to the Empirical Rule?
 of observations are at least
  .
. of observations are between
  and
and  .
. of observations are between
  and
and  .
.
Consider a normal distribution with a mean of
Tap to see back →
-
and 3) are true by definition of the Empirical Rule - also known as the 68-95-99.7 Rule. Using our information with mean of 100 and a standard deviation of 5 we can create a bell curve with 100 in the middle. One standard deviation out from the mean would give us a range from 95 to 105 and would be in our 68% section. If we go two standard deviations out from 100 we would get the range 90 to 110 thus lying in the 95% section. Lastly, when we go out 3 standard deviations we get a range of 85 to 115 thus falling within the 99.7% section.
-
can be deduced as true because it means that 68% of observations are between 95 and 105, and removing one of those bounds (namely, the upper one) adds the 16%, since  , of observations larger than 105 leading to 68 + 16 = 84% of observations greater than 95.
-
and 3) are true by definition of the Empirical Rule - also known as the 68-95-99.7 Rule. Using our information with mean of 100 and a standard deviation of 5 we can create a bell curve with 100 in the middle. One standard deviation out from the mean would give us a range from 95 to 105 and would be in our 68% section. If we go two standard deviations out from 100 we would get the range 90 to 110 thus lying in the 95% section. Lastly, when we go out 3 standard deviations we get a range of 85 to 115 thus falling within the 99.7% section.
-
can be deduced as true because it means that 68% of observations are between 95 and 105, and removing one of those bounds (namely, the upper one) adds the 16%, since
What is the relationship between the mean and the median in a normally distributed population?
What is the relationship between the mean and the median in a normally distributed population?
Tap to see back →
A normal distrubtion is completely symmetrical and has not outliers. This means that the mean is not pulled to either side by outliers and should lie directly in the middle along with the median (the middle number of the distribution).
A normal distrubtion is completely symmetrical and has not outliers. This means that the mean is not pulled to either side by outliers and should lie directly in the middle along with the median (the middle number of the distribution).
Which is the following is NOT a property of the normal distribution?
Which is the following is NOT a property of the normal distribution?
Tap to see back →
The empirical rule tells us that the probability that a random data point is within one standard deviation of the mean is approximately 68%, not 78%.
The empirical rule tells us that the probability that a random data point is within one standard deviation of the mean is approximately 68%, not 78%.
When

and

Find
") .
.
When
and
Find
Tap to see back →


=.8413 - .121 = .7203")
Arrivals to a bed and breakfast follow a Poisson process. The expected number of arrivals each week is 4. What is the probability that there are exactly 3 arrivals over the course of one week?
Arrivals to a bed and breakfast follow a Poisson process. The expected number of arrivals each week is 4. What is the probability that there are exactly 3 arrivals over the course of one week?
Tap to see back →
=\frac{(\lambda $t)^n$$}{n!}$e^{-\lambda t}$=\frac{(4\cdot $1)^3$$}{3!}$e^{-4\cdot 1}$=19.5%")
The masses of tomatoes are normally distributed with a mean of  grams and a standard deviation of
  grams. What mass of tomatoes would be the
  percentile of the masses of all the tomatoes?
The masses of tomatoes are normally distributed with a mean of
Tap to see back →
The Z score for a normal distribution at the  percentile is
  So
So  \approx 0.25") , which can be found on the normal distribution table. The mass of tomatoes in the
, which can be found on the normal distribution table. The mass of tomatoes in the  percentile of all tomatoes is
  standard deviations below the mean, so the mass is
  .
.
The Z score for a normal distribution at the
Find
") .
.
Find
Tap to see back →
First, we use our normal distribution table to find a p-value for a z-score greater than 0.50.
Our table tells us the probability is approximately,
=0.6915") .
.
Next we use our normal distribution table to find a p-value for a z-score greater than 1.23.
Our table tells us the probability is approximately,
=0.8907") .
.
We then subtract the probability of z being greater than 0.50 from the probability of z being less than 1.23 to give us our answer of,
 .
.
First, we use our normal distribution table to find a p-value for a z-score greater than 0.50.
Our table tells us the probability is approximately,
Next we use our normal distribution table to find a p-value for a z-score greater than 1.23.
Our table tells us the probability is approximately,
We then subtract the probability of z being greater than 0.50 from the probability of z being less than 1.23 to give us our answer of,
Find
") .
.
Find
Tap to see back →
First, we use the table to look up a p-value for z > -1.22.
This gives us a p-value of,
=0.1112") .
.
Next, we use the table to look up a p-value for z > 1.59.
This gives us a p-value of,
=0.9441") .
.
Finally we subtract the probability of z being greater than -1.22 from the probability of z being less than 1.59 to arrive at our answer of,
 .
.
First, we use the table to look up a p-value for z > -1.22.
This gives us a p-value of,
Next, we use the table to look up a p-value for z > 1.59.
This gives us a p-value of,
Finally we subtract the probability of z being greater than -1.22 from the probability of z being less than 1.59 to arrive at our answer of,
Gabbie earned a score of 940 on a national achievement test. The mean test score was 850 with a sample standard deviation of 100. What proportion of students had a higher score than Gabbie? (Assume that test scores are normally distributed.)
Gabbie earned a score of 940 on a national achievement test. The mean test score was 850 with a sample standard deviation of 100. What proportion of students had a higher score than Gabbie? (Assume that test scores are normally distributed.)
Tap to see back →
When we get this type of problem, first we need to calculate a z-score that we can use in our table.
To do that, we use our z-score formula:
}{\sigma}$")
where,

Plugging into the equation we get:
}{100}$=\frac{90}{100}$=0.90")
We then use our table to look up a p-value for z > 0.9. Since we want to calculate the probability of students who earned a higher score than Gabbie we need to subtract the P(z<0.9) to get our answer.
=1-P(z<0.90) \P(z>0.90) =1-0.8159 \P(z>0.90)=0.1841")
When we get this type of problem, first we need to calculate a z-score that we can use in our table.
To do that, we use our z-score formula:
where,
Plugging into the equation we get:
We then use our table to look up a p-value for z > 0.9. Since we want to calculate the probability of students who earned a higher score than Gabbie we need to subtract the P(z<0.9) to get our answer.
Which of the following populations has a precisely normal distribution?
Which of the following populations has a precisely normal distribution?
Tap to see back →
A normal distribution is one in which the values are evenly distributed both above and below the mean. A population has a precisely normal distribution if the mean, mode, and median are all equal. For the population of 3,4,5,5,5,6,7, the mean, mode, and median are all 5.
A normal distribution is one in which the values are evenly distributed both above and below the mean. A population has a precisely normal distribution if the mean, mode, and median are all equal. For the population of 3,4,5,5,5,6,7, the mean, mode, and median are all 5.
If a population has a normal distribution, the number of values within one positive standard deviation of the mean will be . . .
If a population has a normal distribution, the number of values within one positive standard deviation of the mean will be . . .
Tap to see back →
In a normal distribution, the number of values within one positive standard deviation of the mean is equal to the number of values within one negative standard deviation of the mean. The reason for this is that the values below the population mean exactly parallel the values above the mean.
In a normal distribution, the number of values within one positive standard deviation of the mean is equal to the number of values within one negative standard deviation of the mean. The reason for this is that the values below the population mean exactly parallel the values above the mean.