Data - AP Statistics
Card 0 of 552
You and your classmate want to test the effect of food coloring on plant color. One of the groups in the experiment receives dye-free water. Which group is this?
You and your classmate want to test the effect of food coloring on plant color. One of the groups in the experiment receives dye-free water. Which group is this?
Tap to see back →
The control group receives no treatment.
The experimental group receives the treatment of the independent variable.
Because the flowers getting no dye do not receive the treatment, it is the control group.
The control group receives no treatment.
The experimental group receives the treatment of the independent variable.
Because the flowers getting no dye do not receive the treatment, it is the control group.
You and your friend want to test the effect of different brands of fertilizer on sunflower height.
One group receives no fertilizer during the course of the experiment.
Which group is this?
You and your friend want to test the effect of different brands of fertilizer on sunflower height.
One group receives no fertilizer during the course of the experiment.
Which group is this?
Tap to see back →
The control group receives no treatment.
The experimental group receives the treatment of the independent variable.
Because the sunflowers getting no fertilizer do not receive the treatment, it is the control group.
The control group receives no treatment.
The experimental group receives the treatment of the independent variable.
Because the sunflowers getting no fertilizer do not receive the treatment, it is the control group.
Of the following examples, which best describes quantitative data?
Of the following examples, which best describes quantitative data?
Tap to see back →
Quantitative data describes a certain type of information that can be counted or expressed numerically and can be used in meaningful computations. Quantitative data is different from qualitative data, which is primarily involved in describing things in terms of categorizations or specific qualities. Looking at the answer choices, it is clear that measuring the temperature of water in degrees Fahrenheit is a numerical piece of information, and is thus quantitative.
Quantitative data describes a certain type of information that can be counted or expressed numerically and can be used in meaningful computations. Quantitative data is different from qualitative data, which is primarily involved in describing things in terms of categorizations or specific qualities. Looking at the answer choices, it is clear that measuring the temperature of water in degrees Fahrenheit is a numerical piece of information, and is thus quantitative.
Find the median of the stem and leaf plot.

Find the median of the stem and leaf plot.
Tap to see back →
The median is the middle value of the set in increasing order.
In this set of 11 entries, the median is the 6th entry of the set in increasing order, or 26.
The median is the middle value of the set in increasing order.
In this set of 11 entries, the median is the 6th entry of the set in increasing order, or 26.
When designing an experiment, what is the purpose of blocking?
When designing an experiment, what is the purpose of blocking?
Tap to see back →
The purpose of blocking, by definition, is to separate a particular sample into groups previously known to be similar in some way that are expected to affect response to treatments. The other choices pertain to control (keeping an extraneous variable constant), randomization (using random chance to assign experimental units to treatments), and replication (increasing the number of experimental units to reduce chance variation) in an experiment.
The purpose of blocking, by definition, is to separate a particular sample into groups previously known to be similar in some way that are expected to affect response to treatments. The other choices pertain to control (keeping an extraneous variable constant), randomization (using random chance to assign experimental units to treatments), and replication (increasing the number of experimental units to reduce chance variation) in an experiment.
Which of the following is an example of qualitative data?
Which of the following is an example of qualitative data?
Tap to see back →
The only example of qualitative data here is the gender of a high school student (i.e. male or female). This cannot be quantified, unlike the other answer choices which all have numbers, quantities, and amounts associated with them.
The only example of qualitative data here is the gender of a high school student (i.e. male or female). This cannot be quantified, unlike the other answer choices which all have numbers, quantities, and amounts associated with them.
A researcher wants to randomly assign participants to a treatment and control group. Which of the following approaches ensures that the treatment assignment is random?
A researcher wants to randomly assign participants to a treatment and control group. Which of the following approaches ensures that the treatment assignment is random?
Tap to see back →
The only random procedure here is the coin flip. In expectation, the coin flip ensures that no background variables influence treatment assignment whereas the other examples either have nothing to do with random assignment (e.g. nationally representative sample) or completely contradict the purpose of random assignment (e.g. assigning the treatment based on who needs it the most).
The only random procedure here is the coin flip. In expectation, the coin flip ensures that no background variables influence treatment assignment whereas the other examples either have nothing to do with random assignment (e.g. nationally representative sample) or completely contradict the purpose of random assignment (e.g. assigning the treatment based on who needs it the most).
A sample consists of the following observations:") . What is the mean?
. What is the mean?
A sample consists of the following observations:
Tap to see back →
The mean is /5= 2.8.")
The mean is
Find the median of the set.

Find the median of the set.
Tap to see back →
The median is the middle value of the set in increasing order.
In this set of 11 entries, the median is the 6th entry of the set in increasing order, or 6.
The median is the middle value of the set in increasing order.
In this set of 11 entries, the median is the 6th entry of the set in increasing order, or 6.
Find the median of the set

Find the median of the set
Tap to see back →
The median is the middle value of the set in increasing order.
In this set of 6 (or any even number of) entries, the median is the mean of the two middle entries of the set in increasing order

or

The median is the middle value of the set in increasing order.
In this set of 6 (or any even number of) entries, the median is the mean of the two middle entries of the set in increasing order
or
Which of the following correlation coefficients indicates the strongest relationship between variables?
Which of the following correlation coefficients indicates the strongest relationship between variables?
Tap to see back →
Correlation coefficients range from 1 to -1. The closer to either extreme, the stronger the relationship. The closer to 0, the weaker the relationship.
Correlation coefficients range from 1 to -1. The closer to either extreme, the stronger the relationship. The closer to 0, the weaker the relationship.
In a regression analysis, the y-variable should be the variable, and the x-variable should be the variable.
In a regression analysis, the y-variable should be the variable, and the x-variable should be the variable.
Tap to see back →
Regression tests seek to determine one variable's ability to predict another variable. In this analysis, one variable is dependent (the one predicted), and the other is independent (the variable that predicts). Therefore, the dependent variable is the y-variable and the independent variable is the x-variable.
Regression tests seek to determine one variable's ability to predict another variable. In this analysis, one variable is dependent (the one predicted), and the other is independent (the variable that predicts). Therefore, the dependent variable is the y-variable and the independent variable is the x-variable.
On a residual plot, the  -axis displays the and the
  -axis displays .
On a residual plot, the
Tap to see back →
A residual plot shows the difference between the actual and expected value, or residual. This goes on the y-axis. The plot shows these residuals in relation to the independent variable.
A residual plot shows the difference between the actual and expected value, or residual. This goes on the y-axis. The plot shows these residuals in relation to the independent variable.
Tap to see back →
No explanation available
No explanation available
What transformation should be done to the data set, with its residual shown below, to linearize the data?
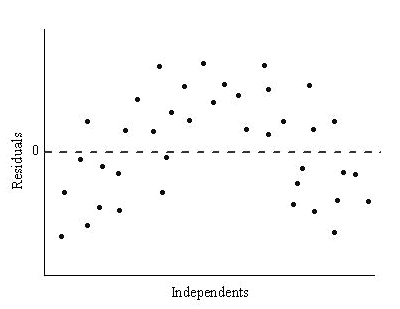
What transformation should be done to the data set, with its residual shown below, to linearize the data?
Tap to see back →
Taking the log of a data set whose residual is nonrandom is effective in increasing the correleation coefficient and results in a more linear relationship.
Taking the log of a data set whose residual is nonrandom is effective in increasing the correleation coefficient and results in a more linear relationship.
A national study on cell phone use found the following correlations:
-The correlation between the number of texts sent each day and a person's average credit card debt is  .
.
-The correlation between the number of texts sent each day and the number of books read each month is  .
.
Which of the following statements are true?
i. As the number of texts sent each day increases, average credit card debt increases.
ii. Sending more texts causes people to read less.
iii. A person's average credit card debt is related more strongly to the number of texts sent each day than the number of books read each month is related to the number of texts sent each day.
A national study on cell phone use found the following correlations:
-The correlation between the number of texts sent each day and a person's average credit card debt is
-The correlation between the number of texts sent each day and the number of books read each month is
Which of the following statements are true?
i. As the number of texts sent each day increases, average credit card debt increases.
ii. Sending more texts causes people to read less.
iii. A person's average credit card debt is related more strongly to the number of texts sent each day than the number of books read each month is related to the number of texts sent each day.
Tap to see back →
i is correct because there is a positive correlation between the number of texts sent each day and average credit card debt.
ii is incorrect because the word "cause" was used in the statement. Correlation does not mean causation. There is a relationship between the number of texts sent each day and the number of books that a person reads each month. However, the number of texts sent each day does not cause a person to read a certain number of books each month.
iii is correct because the absolute values of the correlations indicate which correlation is stronger.  is a stronger correlation than
  .
.
i is correct because there is a positive correlation between the number of texts sent each day and average credit card debt.
ii is incorrect because the word "cause" was used in the statement. Correlation does not mean causation. There is a relationship between the number of texts sent each day and the number of books that a person reads each month. However, the number of texts sent each day does not cause a person to read a certain number of books each month.
iii is correct because the absolute values of the correlations indicate which correlation is stronger.
Which of the following shows the least correlation between two variables?
Which of the following shows the least correlation between two variables?
Tap to see back →
The strength of correlation is measured on an absolute value scale of  to
to  with
with  being the least correlated and
  being the most correlated. The positive or negative in front of the correlation integer simply determines whether or not there is a positive or negative correlation between the variables.
A correlation of  means that there is no correlation at all between two variables.
The strength of correlation is measured on an absolute value scale of
A correlation of
In a medical school, it is found that there is a correlation of  between the amount of coffee consumed by students and the number of hours students sleep each night. Which of the following is true?
i. There is a positive association between the two variables.
ii. There is a strong correlation between the two variables.
iii. Coffee consumption in medical school students causes students to sleep less each night.
In a medical school, it is found that there is a correlation of
i. There is a positive association between the two variables.
ii. There is a strong correlation between the two variables.
iii. Coffee consumption in medical school students causes students to sleep less each night.
Tap to see back →
Since the correlation is negative, there must be a negative association between the two variables (therefore statement i is incorrect). Statement ii is correct since a correlation of  to
to  on an absolute value scale of
  to
to  is considered to be a strong correlation. Statement iii is incorrect since correlation does not mean causation.
Since the correlation is negative, there must be a negative association between the two variables (therefore statement i is incorrect). Statement ii is correct since a correlation of
It is found that there is a correlation of exactly  between two variables. Which of the following is incorrect?
It is found that there is a correlation of exactly
Tap to see back →
Under no circumstance will correlation ever equate to causation, regardless of how strong the correlation between two variables is. In this case, all other answer choices are correct.
Under no circumstance will correlation ever equate to causation, regardless of how strong the correlation between two variables is. In this case, all other answer choices are correct.
Shawn would like to determine what the most popular television channel is in his town, called Hearne.
Which of the following would be an appropriate target population for the survey?
Shawn would like to determine what the most popular television channel is in his town, called Hearne.
Which of the following would be an appropriate target population for the survey?
Tap to see back →
Since Shawn would like to know the most popular television channel in his town, he must include all residents of the town in his target population. The sample must come from the directory and each person in the directory should have an equal chance of being selected. The incorrect options are too narrowly focused and are not representative of the town.
Since Shawn would like to know the most popular television channel in his town, he must include all residents of the town in his target population. The sample must come from the directory and each person in the directory should have an equal chance of being selected. The incorrect options are too narrowly focused and are not representative of the town.