What this quiz covers
This quiz focuses on Interpreting Data From Tables, giving you a quick way to practice the rules, question types, and explanations that matter most for ACT Science.
PASSAGE VI
BIOLOGY / GENETICS: Research Summary
Introduction
Restriction enzymes are proteins that cut DNA molecules at specific, predictable sequences of base pairs (bp). Gel electrophoresis is a technique used to separate these resulting DNA fragments by size. When an electrical current is applied to the gel, the negatively charged DNA fragments migrate toward the positive electrode. Smaller DNA fragments move through the gel much faster and travel further than larger fragments.
A researcher isolated a circular bacterial plasmid (a ring of DNA) consisting of exactly 5,000 bp. To map the plasmid, the researcher treated identical samples of the plasmid with different restriction enzymes—Enzyme 1 (E1), Enzyme 2 (E2), and Enzyme 3 (E3)—both individually and in combinations.
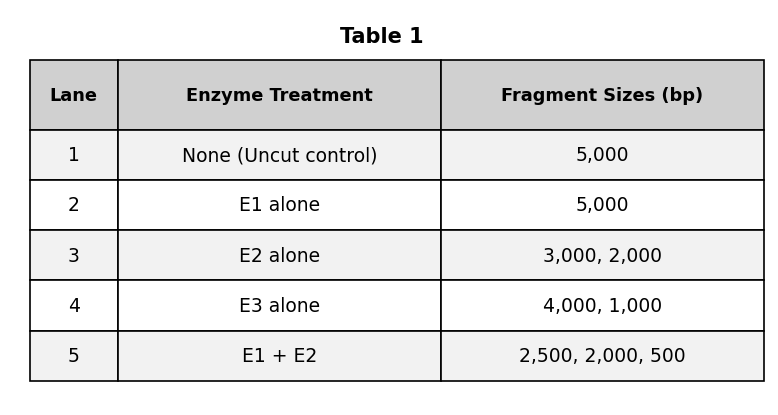
After allowing the enzymes to cut the DNA, the researcher ran the samples on an electrophoresis gel. A dye was added to make the DNA bands visible. The size of the fragments in each band was recorded in Table 1.
Based on the passage, which of the following fragments from Table 1 would migrate the furthest distance from the starting well during electrophoresis?
ACT Science Quiz
Practice Interpreting Data From Tables in ACT Science with focused quiz questions that help you check what you know, review explanations, and build confidence with test-style prompts.
This quiz focuses on Interpreting Data From Tables, giving you a quick way to practice the rules, question types, and explanations that matter most for ACT Science.
Try each quiz question before looking at the correct answer. Use the explanations to review missed ideas, then come back to similar questions until the pattern feels familiar.
PASSAGE VI
BIOLOGY / GENETICS: Research Summary
Introduction
Restriction enzymes are proteins that cut DNA molecules at specific, predictable sequences of base pairs (bp). Gel electrophoresis is a technique used to separate these resulting DNA fragments by size. When an electrical current is applied to the gel, the negatively charged DNA fragments migrate toward the positive electrode. Smaller DNA fragments move through the gel much faster and travel further than larger fragments.
A researcher isolated a circular bacterial plasmid (a ring of DNA) consisting of exactly 5,000 bp. To map the plasmid, the researcher treated identical samples of the plasmid with different restriction enzymes—Enzyme 1 (E1), Enzyme 2 (E2), and Enzyme 3 (E3)—both individually and in combinations.
After allowing the enzymes to cut the DNA, the researcher ran the samples on an electrophoresis gel. A dye was added to make the DNA bands visible. The size of the fragments in each band was recorded in Table 1.
Based on the passage, which of the following fragments from Table 1 would migrate the furthest distance from the starting well during electrophoresis?
Fruit Fly Genetics
In the fruit fly Drosophila melanogaster, eye color is a sex-linked trait determined by a gene on the X chromosome. The allele for the wild-type red eye color (XR) is dominant, while the allele for the mutant white eye color (Xr) is recessive.
Females (XX): Inherit one X chromosome from each parent. A female will have white eyes only if she is homozygous recessive (XrXr).
Males (XY): Inherit an X chromosome from the mother and a Y chromosome from the father. Because the Y chromosome does not carry the eye color gene, a male expresses whichever allele is present on his single X chromosome (X^R Y \= Red; X^r Y \= White).
Students conducted two studies to observe these inheritance patterns.
The students crossed a homozygous red-eyed female (XRXR) with a white-eyed male (XrY). To predict the genotypes of the offspring, they constructed a Punnett square (Figure 1).
They then collected 100 offspring (the F1 generation) and recorded the results in Table 1.
The students performed the reciprocal cross. They crossed a white-eyed female (XrXr) with a red-eyed male (XRY). A second Punnett square was constructed to predict the outcome (Figure 2).
They collected 100 offspring and recorded the results in Table 2.
Based on Table 1, what percent of the F1 offspring in Study 1 had white eyes?
A chemistry lab measured the pH of a buffer solution after adding different volumes of acid. Use Table 1 to answer the question.
When 6.0 mL of acid was added, the pH was:
Researchers tested how water temperature affects the time needed for a tablet to dissolve in 200 mL of water. Each trial used the same tablet mass and the same stirring rate. The results are shown in Table 1.
According to Table 1, what was the dissolve time when the water temperature was 40 °C?
An environmental lab measured nitrate concentration in river water at different distances downstream from a wastewater outlet. Samples were collected the same day and analyzed with the same instrument. Table 1 reports the results.
At a distance of 5.0 km downstream, the nitrate concentration was:
PASSAGE VI
PHYSICS: Research Summary
Introduction
Engineers test model wind turbines in wind tunnels to determine how different design parameters affect electrical power output. The power output of a turbine (measured in milliwatts, mW) depends on the wind speed and the pitch angle of the blades. The pitch angle is the angle at which the blades are twisted relative to the oncoming wind.
Study 1
Engineers built a model turbine and placed it in a wind tunnel. They locked the blade pitch angle at a constant 15°. They then turned on the wind tunnel, varying the wind speed from 2.0 meters per second (m/s) to 10.0 m/s. In Table 1, they recorded the power output of the turbine at each wind speed.
Study 2
The engineers wanted to find the optimal pitch angle for the turbine blades. They set the wind tunnel to blow at a constant wind speed of 8.0 m/s. They then adjusted the blade pitch angle from 0° to 40° and recorded the resulting power output. Findings are shown in Table 2.
Based on Table 2, what is the relationship between blade pitch angle and power output? As the pitch angle increases from 0° to 40°, the power output:
PASSAGE VII
PHYSICS: Data Representation
Introduction
A student investigated the relationship between voltage (V), current (I), and resistance (R) in a simple direct current (DC) electrical circuit.
•Voltage (V) is the electrical potential difference provided by a power source, measured in volts (V).
•Current (I) is the rate of flow of electrical charge, measured in amperes (A).
•Resistance (R) is the opposition to the flow of charge, measured in ohms (Ω).
The student set up a circuit containing a variable voltage power supply, a resistor, and an ammeter (a device used to measure current).
Experiment 1
In the first experiment, the student used a resistor with a constant resistance of 10.0 Ω. The student varied the voltage supplied to the circuit from 2.0 V to 10.0 V and recorded the resulting current measured by the ammeter. Results are shown in Table 1.
Experiment 2
In the second experiment, the student set the power supply to provide a constant voltage of 12.0 V. The student then swapped out the resistor, testing five different resistors with varying resistance values, and recorded the resulting current for each. Results are shown in Table 2.
Based on Table 2, as the resistance in the circuit increases from 2.0 Ω to 12.0 Ω, the current in the circuit:
PASSAGE II
BIOLOGY: Research Summary
Soil salinity (salt concentration) and pH can significantly affect seed germination. A botanist conducted two studies to determine how these factors influence the germination rate of Medicago sativa (alfalfa) seeds. •Note: Germination rate is the percentage of planted seeds that successfully sprout.
Study 1
The botanist prepared 5 identical planting trays. Each tray was filled with 1 kilogram (kg) of the same potting soil. The botanist adjusted the soil in each tray to have a different concentration of sodium chloride (NaCl), measured in millimoles per kilogram (mM/kg). The soil pH for all trays was kept constant at 6.5.
Fifty M. sativa seeds were planted in each tray. The trays were placed in a greenhouse with a constant temperature of 25∘C and watered equally every day for 14 days. On day 14, the germination rate was recorded. Results are shown in Table 1.
Study 2
The botanist prepared 5 new trays with the same potting soil. This time, the NaCl concentration in all trays was kept constant at 40 mM/kg. The botanist adjusted the soil pH in each tray to a different value, ranging from highly acidic to highly basic.
Fifty M. sativa seeds were planted in each tray. The greenhouse conditions, watering schedule, and duration were identical to those in Study 1. Results are shown in Table 2.
According to the results of Study 1, as the NaCl concentration increased from 0 mM/kg to 160 mM/kg, the germination rate of M. sativa seeds:
PASSAGE VI
BIOLOGY / GENETICS: Research Summary
Introduction
Restriction enzymes are proteins that cut DNA molecules at specific, predictable sequences of base pairs (bp). Gel electrophoresis is a technique used to separate these resulting DNA fragments by size. When an electrical current is applied to the gel, the negatively charged DNA fragments migrate toward the positive electrode. Smaller DNA fragments move through the gel much faster and travel further than larger fragments.
A researcher isolated a circular bacterial plasmid (a ring of DNA) consisting of exactly 5,000 bp. To map the plasmid, the researcher treated identical samples of the plasmid with different restriction enzymes—Enzyme 1 (E1), Enzyme 2 (E2), and Enzyme 3 (E3)—both individually and in combinations.
After allowing the enzymes to cut the DNA, the researcher ran the samples on an electrophoresis gel. A dye was added to make the DNA bands visible. The size of the fragments in each band was recorded in Table 1.
According to Table 1, how many distinct DNA bands would be visible in Lane 3 of the electrophoresis gel?
PASSAGE II
BIOLOGY: Research Summary
Introduction
Transpiration is the process by which moisture is carried through plants from roots to small pores on the underside of leaves, where it changes to vapor and is released to the atmosphere. A botanist conducted two studies to investigate how environmental factors affect the transpiration rate of Spathiphyllum (peace lily) plants.
Study 1
The botanist placed 5 identical Spathiphyllum plants into 5 identical environmentally controlled chambers. The relative humidity inside all chambers was kept constant at 40%, and the temperature was kept constant at 22°C. The botanist varied the light intensity—measured in micromoles of photons per square meter per second (μmol/m2/s)—in each chamber. After 4 hours, the botanist measured the mass of water lost by each plant to calculate the transpiration rate in milligrams of water per square centimeter of leaf area per hour (mg/cm2/hr). Results are shown in Table 1.
Study 2
The botanist obtained 5 new, identical Spathiphyllum plants and placed them in the chambers. This time, the light intensity in all chambers was kept constant at 400 μmol/m2/s and the temperature at 22°C. The botanist varied the relative humidity in each chamber. The transpiration rates were calculated after 4 hours. Results are shown in Table 2.
Based on Study 2, what is the relationship between relative humidity and transpiration rate?
A research vessel lowered a probe at a single ocean station and recorded water temperature and salinity at five depths on the same cast. Table 1 shows the measurements.
Based on Table 1, as depth increased, temperature and salinity changed in which of the following ways?
A radioactive sample was placed next to a detector and its count rate was recorded every 10 minutes. The half-life is the time required for the count rate to fall to half its earlier value. Table 1 shows the measurements.
Based on Table 1, the half-life of this sample is closest to which time?
A researcher cut a core from one tree and measured the width of the growth ring formed in each of five years. Rainfall totals for the same years were taken from a nearby weather station. Table 1 shows both sets of records.
Based on Table 1, what was the ring width in the year with the least rainfall?
Table 1 lists the surface temperature and luminosity of four stars. Luminosity is given relative to the Sun, so a value of 25 means the star emits 25 times as much energy per second as the Sun.
Based on Table 1, which star has a lower surface temperature but a greater luminosity than Star W?
A student was given an unlabeled metal sample. She measured its melting point as 963 °C and its density as 10.5 g/cm³, using the same methods that produced the accepted values in Table 1.
Based on Table 1, the sample is most likely which metal?
An astronomer catalogued the mass and volume of four planets. Average density is mass divided by volume. Table 1 shows the catalogue entries.
Based on Table 1, which planet has the greatest average density?
The same reaction was run six times with different masses of catalyst and no other changes. Each run was stopped after exactly 30 minutes, and the percentage of the starting material converted to product was recorded. Table 1 shows the results.
Based on Table 1, above which catalyst mass does adding more catalyst produce almost no further gain in yield?
A chemist measured the initial rate at which hydrogen peroxide decomposed in five solutions of different concentration. Each solution was tested once at 25 °C and once at 35 °C. Table 1 shows the results. The chemist then prepared a 0.60 M solution and planned to repeat the 25 °C trial with it.
Based on Table 1, the initial rate for the 0.60 M solution at 25 °C would most likely be closest to which rate?
A fixed amount of gas was sealed in a syringe held at constant temperature. The plunger was moved to five volumes and the pressure was recorded at each. Table 1 shows the results.
Which of the following statements about the measurements in Table 1 is correct?
A student hung masses from a spring and measured how far the spring stretched below its resting length. The spring returned to its resting length after each mass was removed. Table 1 shows the results.
Based on Table 1, a 700 g mass would most likely stretch the spring by about how far?