Drawing Conclusions & Evaluating Claims
Help Questions
ACT Science › Drawing Conclusions & Evaluating Claims
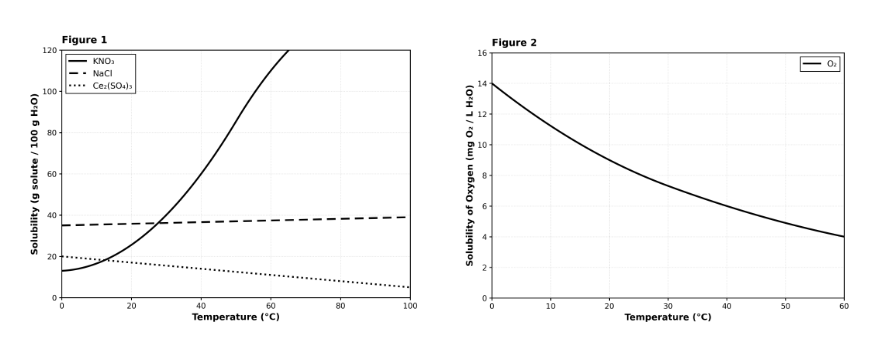
A student dissolves 50 g of KNO₃ in 100 g of water at 40°C. Based on Figure 1, the resulting solution would be best described as:
dilute, because KNO₃ is insoluble at 40°C.
saturated, because 50 g is exactly the maximum solubility at 40°C.
unsaturated, because 50 g is less than the maximum solubility of 60 g at 40°C.
supersaturated, because 50 g is greater than the maximum solubility at 40°C.
Explanation
This is a concept application question requiring you to understand solubility definitions and apply them to graph data. According to Figure 1, KNO₃ has a solubility of approximately 60 g/100 g H₂O at 40°C. This means up to 60 g can dissolve at this temperature. Since the student only dissolved 50 g, which is less than the maximum of 60 g, more could still dissolve. By definition, this makes the solution unsaturated (not yet at maximum capacity). Choice B is correct. Choice A (saturated) would only be true if exactly 60 g were dissolved. Choice C (supersaturated) would require dissolving MORE than the maximum, which typically requires special cooling techniques. Choice D (dilute/insoluble) is nonsensical—the graph clearly shows KNO₃ does dissolve at 40°C. Pro tip: Saturated = at maximum; Unsaturated = below maximum; Supersaturated = above maximum (unstable).
A city tested a new bus-lane policy intended to reduce commute times. Commute times (minutes) were recorded for 30 randomly selected bus riders one week before implementation and for 30 bus riders one week after. The riders before and after were not necessarily the same individuals. Weather conditions differed: the “after” week had heavier rain on most days.
Table 1 shows the mean commute times. The author concluded: “The bus-lane policy increased commute times.”
Which of the following is a flaw in the author’s reasoning?
The conclusion ignores a potential confounder: heavier rain could increase commute times independent of the policy.
The conclusion is flawed because using different riders before and after always eliminates confounding variables.
The conclusion is flawed because commute time cannot be measured in minutes.
The conclusion is flawed because a larger mean after implementation must indicate improved commutes.
Explanation
The flaw in the author's reasoning is ignoring a potential confounding variable: weather conditions. The data show longer mean commute times after the bus-lane policy implementation, but the "after" week had heavier rain on most days compared to the "before" week. Heavy rain typically increases traffic congestion and slows all vehicles, including buses, independent of any lane policy. Without controlling for weather conditions or comparing similar weather days, we cannot determine whether the increased commute times were due to the policy or the rain. The conclusion incorrectly attributes the entire effect to the policy while ignoring this obvious alternative explanation.
Suppose a new survey of the Milky Way's halo reveals a vast population of billions of rogue planets and brown dwarfs, totaling 5 times the mass of all visible stars. This finding would strictly support the hypothesis of:
Scientist 2.
Scientist 3.
Scientist 1.
both Scientist 1 and Scientist 3.
Explanation
This is a prediction/evidence evaluation question. Scientist 2 explicitly proposes that dark matter consists of MACHOs: "black holes, neutron stars, brown dwarfs (failed stars), and rogue planets." Finding billions of rogue planets and brown dwarfs would directly confirm Scientist 2's hypothesis. Choice B is correct. Choice A (Scientist 1) proposes WIMPs (exotic particles), not normal matter objects. Choice C (Scientist 3) rejects the existence of missing mass entirely. Choice D is illogical—Scientists 1 and 3 have opposing views. Pro tip: Match new evidence to the specific prediction each hypothesis makes.
Ecologists investigated whether adding artificial nest boxes increases the number of breeding pairs of a bird species in urban parks. Four parks received 20 nest boxes each (Box parks) and four similar parks received none (No-box parks). Breeding pairs were counted in spring before installation (Year 0) and the next spring (Year 1). One Box park underwent tree removal between years.
Authors concluded: “Nest boxes caused the population increase observed in Year 1.”
Which of the following is a flaw in the author's reasoning?
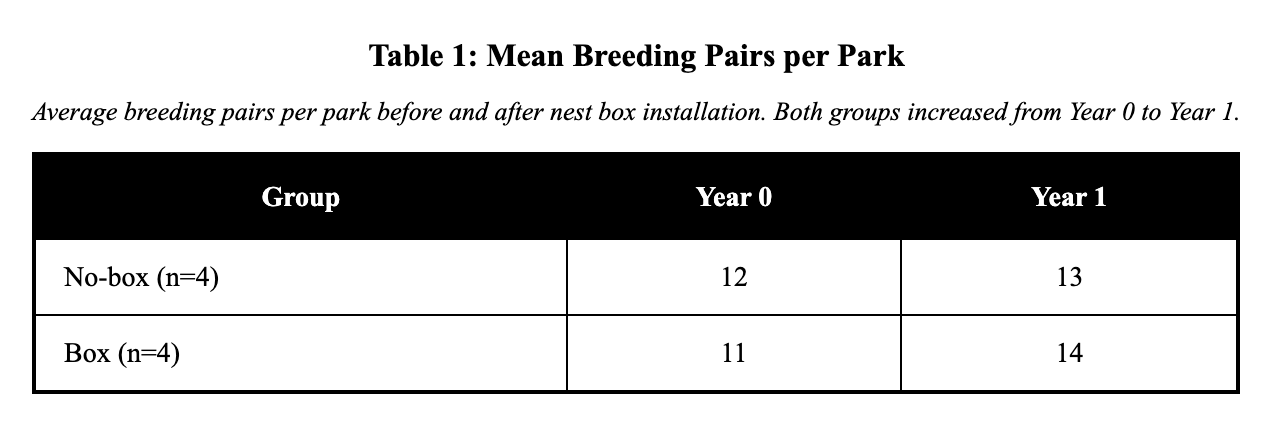
They assume causation, but both groups increased; factors like year-to-year conditions could explain the change.
They fail to measure breeding pairs in Year 0, so no baseline exists for comparison.
They ignore that tree removal occurred, which must mean nest boxes reduced breeding in all Box parks.
They used too many parks; a smaller sample would better isolate the effect of nest boxes.
Explanation
The flaw is that the authors assume causation when both groups increased, and other factors like year-to-year environmental conditions could explain the population changes. The data show both No-box parks (12→13 pairs) and Box parks (11→14 pairs) increased from Year 0 to Year 1, indicating favorable breeding conditions affected all parks. While Box parks had a slightly larger increase (3 vs 1 pair), this difference could result from natural population fluctuations, habitat quality differences, or the tree removal mentioned in one Box park. The lack of a true control group receiving no intervention prevents isolating the nest box effect from temporal confounding variables.
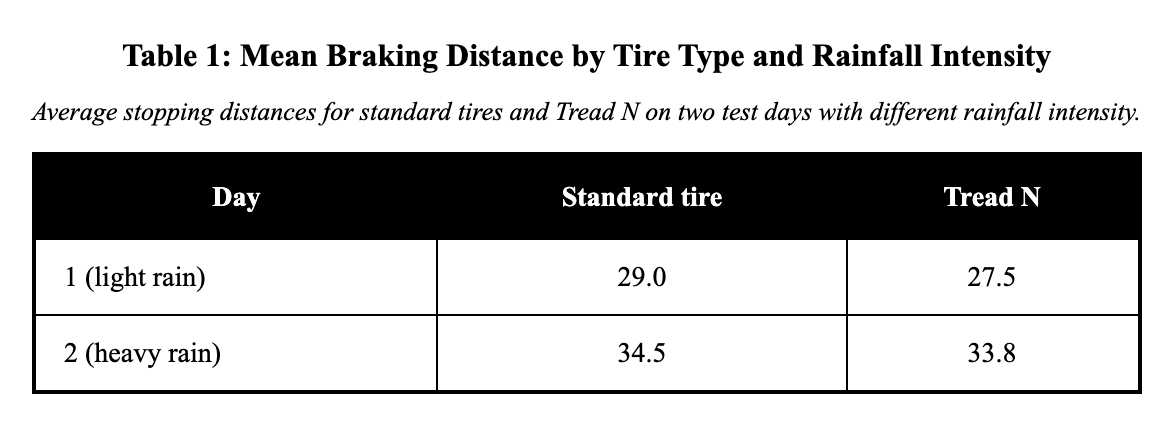
Engineers evaluated whether a new tire tread (Tread N) improves braking distance on wet pavement. Ten cars of the same model were tested on a closed track. Each car performed two braking trials from 60 km/h: one with standard tires and one with Tread N. Testing occurred on two different days; Day 2 had heavier rainfall.
The authors concluded: “Tread N reduces wet braking distance under rainy conditions.”
Which statement best evaluates the validity of the author's conclusion?
Invalid: longer distances on Day 2 prove Tread N increases braking distance in heavy rain.
Valid: Tread N has shorter mean braking distance than standard tires on both test days.
Valid: Day 2 shows the largest distances, proving tread design is the only factor affecting braking.
Invalid: because rainfall differed by day, no comparison between tire types can be made within each day.
Explanation
The conclusion is valid because Tread N consistently shows shorter mean braking distances than standard tires on both test days despite different weather conditions. On Day 1 (light rain), Tread N averaged 27.5m versus 29.0m for standard tires, and on Day 2 (heavy rain), it averaged 33.8m versus 34.5m for standard tires. While heavy rain increased stopping distances for both tire types, the consistent pattern across different conditions supports the claim that Tread N improves wet braking performance. The within-day comparisons control for environmental factors like rainfall intensity.
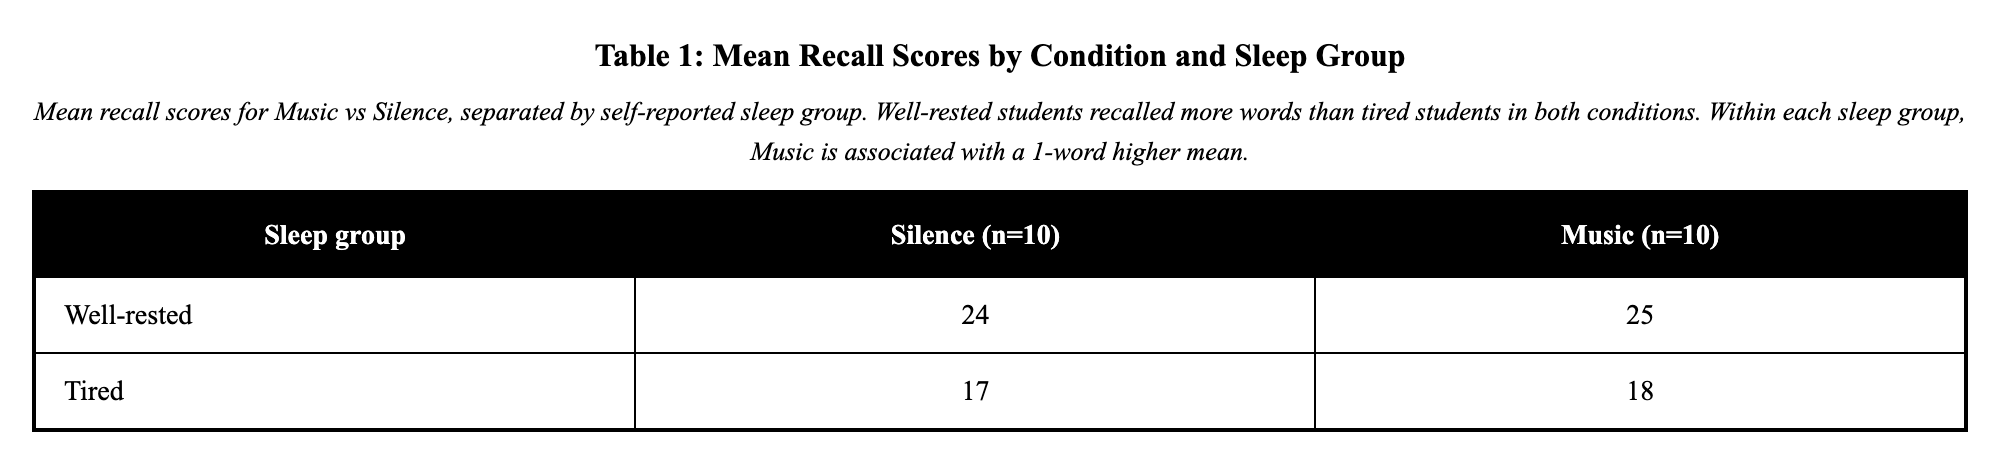
A study examined whether listening to instrumental music improves memory recall. Forty students were assigned to either Music or Silence during a 15-minute study period. Students then completed a 30-word recall test. Researchers also recorded whether students reported being “well-rested” (≥7 hours sleep) or “tired” (<7 hours).
The authors concluded: “Instrumental music significantly improves memory recall for students.”
The conclusion that the authors’ claim is:
Supported: a 1-word advantage in both groups proves music meaningfully improves recall for all students.
Supported: the difference between well‑rested and tired groups confirms music improves recall by increasing alertness.
Not supported: the data show sleep status has a much larger effect than music, and no significance is demonstrated.
Not supported: because tired students score lower, music must decrease recall by distracting them.
Explanation
The claim is not supported because sleep status has a much larger effect on recall than music, and no statistical significance is demonstrated. The data show well-rested students recalled 7-8 more words than tired students (24-25 vs 17-18), while music provided only a 1-word advantage in each sleep group. This 1-word difference is minimal and could easily result from random variation rather than a meaningful effect. The authors cannot conclude 'significant improvement' without statistical testing, and the much larger sleep effect suggests individual factors outweigh any potential music benefit.
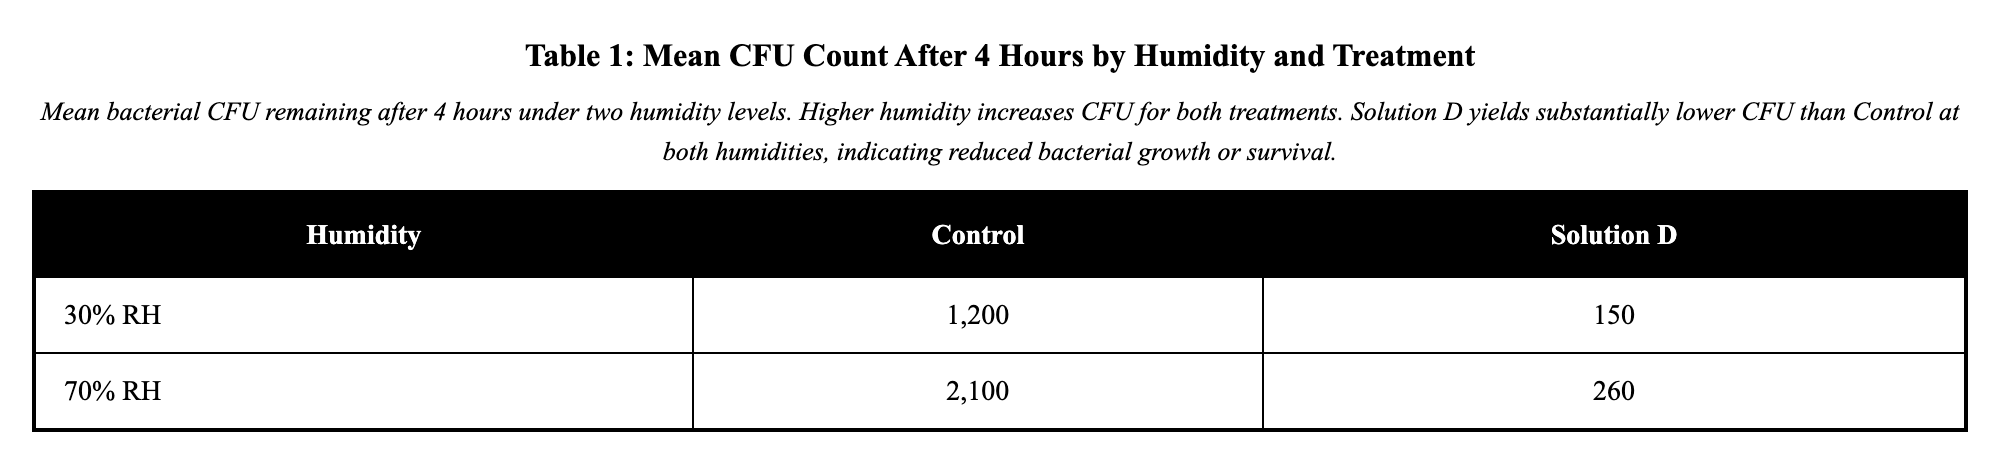
A lab tested whether a disinfectant (Solution D) reduces bacterial growth on countertops. Identical countertop squares were inoculated with bacteria and then treated with either Solution D or water (Control). After 4 hours, technicians counted colony-forming units (CFU). The experiment was repeated at two room humidities.
Based on the data, which conclusion is most strongly supported?
Humidity has no effect on CFU because Solution D lowers CFU under both humidity conditions.
Solution D works only at low humidity, since CFU counts are higher at 70% RH than 30% RH.
Solution D eliminates all bacteria regardless of humidity, proving complete sterilization within 4 hours.
Solution D reduces CFU relative to water at both humidities tested, though humidity still affects overall CFU.
Explanation
Solution D reduces CFU relative to water control at both humidity levels tested, though humidity still affects overall bacterial survival. At 30% humidity, Solution D yields 150 CFU compared to 1,200 for Control (87.5% reduction), and at 70% humidity, it yields 260 CFU versus 2,100 for Control (87.6% reduction). The consistently large reductions demonstrate Solution D's effectiveness across humidity conditions. However, humidity clearly influences bacterial growth since both treatments show higher CFU at 70% than 30% humidity, indicating environmental factors interact with but don't eliminate the disinfectant's antimicrobial effect.
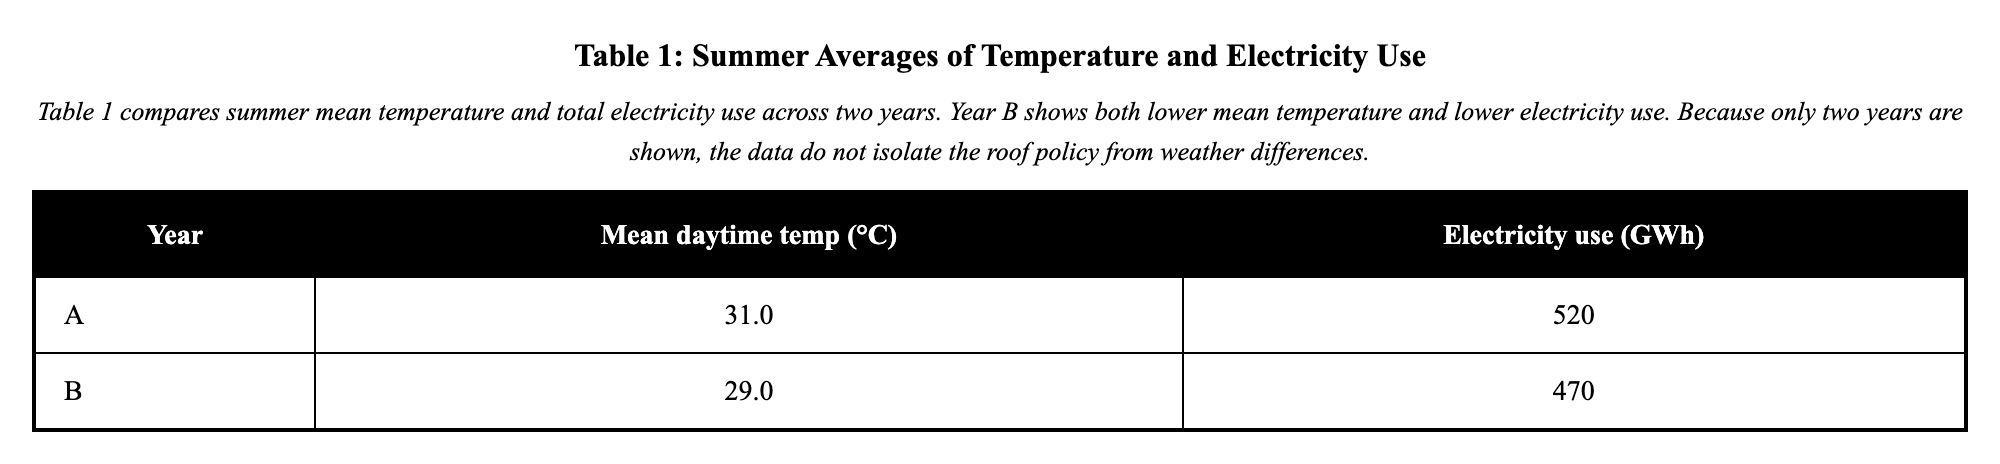
Meteorologists examined whether a city’s new reflective roof policy reduced summer electricity demand. Monthly mean daytime temperature and total electricity use were recorded for June–August in the year before the policy (Year A) and the year after (Year B). No other energy policies were reported, but Year B had a cooler summer.
The authors concluded: “Reflective roofs reduced summer electricity demand.”
Which statement best evaluates the validity of the author's conclusion?
Valid: cooler temperatures prove reflective roofs worked by reducing city heat, lowering electricity demand.
Invalid: electricity use is measured in GWh, so it cannot be compared across different years.
Invalid: lower electricity use could be due to the cooler summer in Year B, a confounding variable.
Valid: because electricity use dropped after the policy, the policy must be the primary cause.
Explanation
The conclusion is invalid because the cooler summer temperatures in Year B (29.0°C vs 31.0°C) provide an alternative explanation for reduced electricity use (470 vs 520 GWh). Since air conditioning demand typically drives summer electricity consumption, the 2°C temperature difference could account for the 50 GWh reduction without any contribution from reflective roofs. The study lacks a control group and cannot separate the policy effect from the confounding variable of weather variation. Multiple factors influence electricity demand, making it impossible to attribute causation to the roof policy based on this observational data.
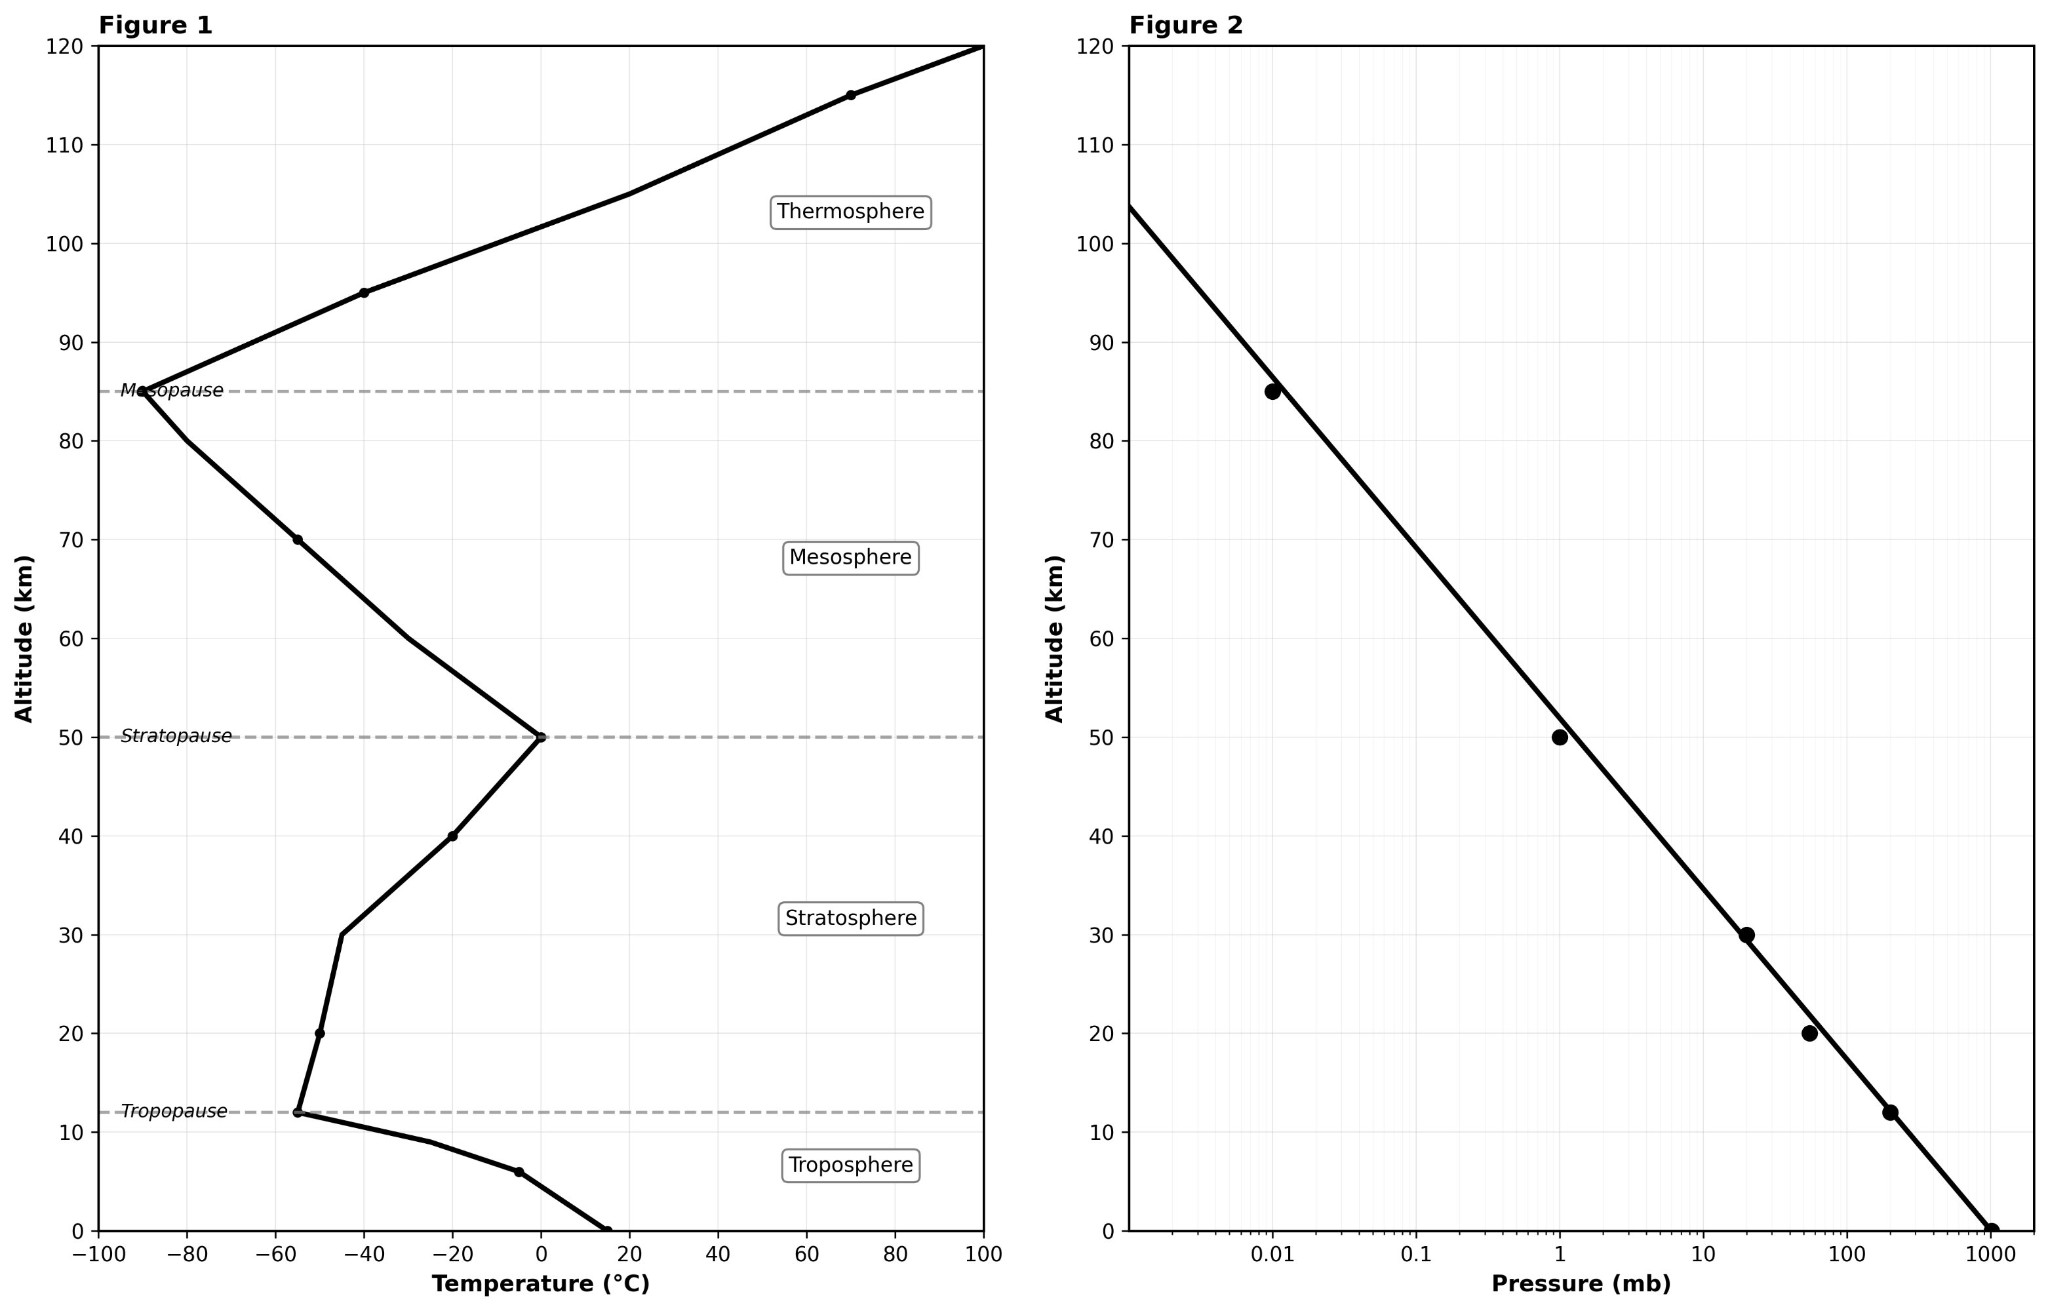
Atmospheric pressure is defined as the force exerted by the weight of the air above a given point. Based on Figure 2, which of the following statements best explains why atmospheric pressure decreases with altitude?
The ozone layer in the stratosphere blocks solar radiation.
Gravity increases as distance from the Earth's center increases.
There is less air mass above a point at higher altitudes.
The temperature decreases in the troposphere.
Explanation
This is a scientific reasoning question that combines a definition with data interpretation to explain a physical phenomenon. You can recognize this question type because the stem provides a definition ("Atmospheric pressure is defined as...") and then asks you to use that definition with the figure to explain a trend. The definition tells you $pressure = \text{weight of air above a point}$. If you go higher in altitude, there is literally less air above you (you've climbed through some of it), so the weight pressing down decreases. This explains why Figure 2 shows pressure dropping with altitude. Choice D focuses on temperature, but temperature doesn't directly explain pressure changes (they're related but not causal in this way). Choice C mentions the ozone layer, which is irrelevant to why pressure decreases. Choice A is factually wrong—gravity decreases (slightly) with altitude, not increases, and this wouldn't explain pressure drop anyway. Remember: When a question provides a definition, that definition contains the key to the answer—use it directly in your reasoning!
Researchers assessed the impact of caffeine on memory retention. Table 12 shows memory scores with varying caffeine doses. Which statement best evaluates the author's conclusion that caffeine improves memory?
Valid; maximum scores at zero caffeine.
Invalid; caffeine decreases scores.
Invalid; data show no significant change.
Valid; scores increase with caffeine.
Explanation
The conclusion is valid if memory scores increase with caffeine doses according to the table data. The results would show higher memory retention scores at increasing caffeine levels, demonstrating caffeine's cognitive enhancement effects. This supports the stimulant's role in improving alertness and memory consolidation processes. If the data show a clear positive relationship between caffeine dose and memory performance, the author's conclusion is justified by the experimental evidence.