All questions
Question 1
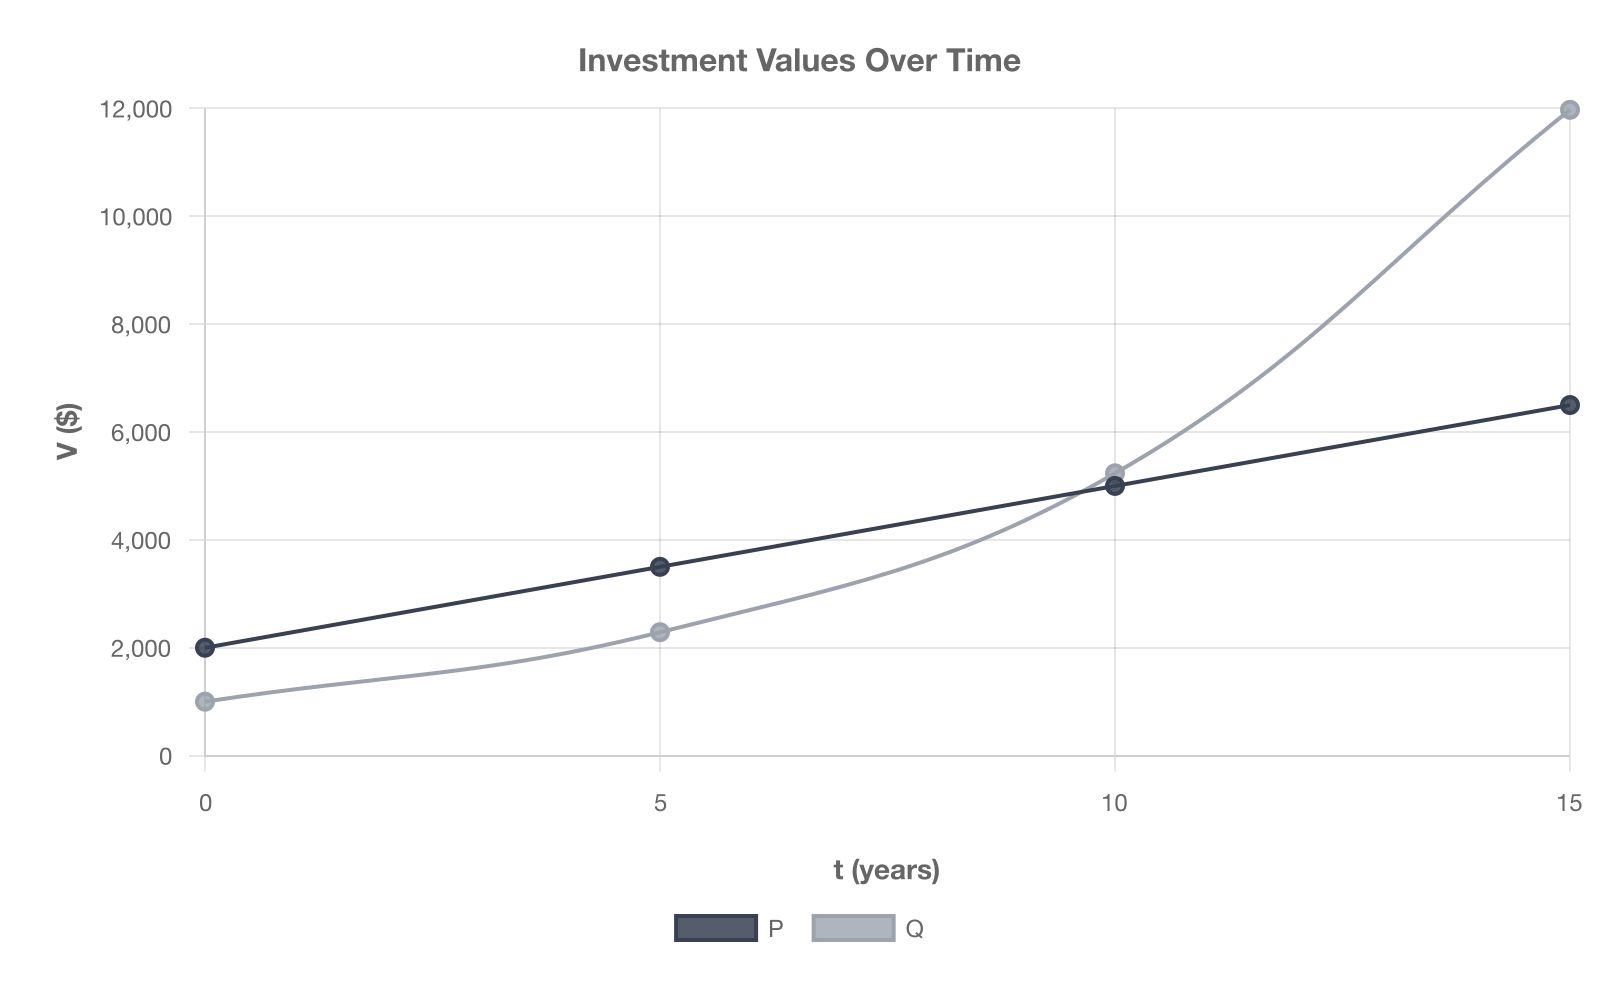
The graph shown shows the value V of two different investments, P and Q, over time t (in years). Investment P grows linearly and investment Q grows exponentially. Approximately how many years after t=0 will investment Q first exceed investment P?
- 5 years
- 7 years
- 10 years (correct answer)
- 12 years
Explanation: P(t) = 2000 + 300t (linear through (0,2000) and (10,5000)). Q(t) = 1000·(1.18)^t. Q(10) ≈ 1000·5.23 ≈ 5230, while P(10) = 5000. Checking Q(9) ≈ 4435 < P(9)=4700. So Q first exceeds P near t=10. (A), (B) occur before crossover; (D) is too late.
Question 2
A delivery service charges a base fee plus a constant amount per mile. The relationship between miles m and cost C is shown by the line on the graph passing through (0,6) and (10,26). What is the base fee?
- $2
- $6 (correct answer)
- $20
- $26
Explanation: The question asks for the base fee from the linear graph of cost C versus miles m passing through (0,6) and (10,26). The straight line indicates a linear model with constant additive cost per mile. The y-intercept at (0,6) is the base fee of $6. This emphasizes additive changes, unlike exponential multiplication. A common error is mistaking the total at m=10 for the base. Use the intercept directly for fixed costs in linear models.
Question 3
A car's value decreases by 12% each year. After 5 years, the car is worth what percent of its original value (to the nearest whole percent)?
- 40%
- 60%
- 53% (correct answer)
- 35%
Explanation: When you see a question about something decreasing by the same percentage each year, you're dealing with exponential decay. The key insight is that each year, the car retains 88% of its value from the previous year (since it loses 12%).
To find the car's value after 5 years, you multiply the original value by 0.88 five times: Final value=Original value×(0.88)5
Let's calculate: (0.88)5=0.88×0.88×0.88×0.88×0.88=0.5277
Converting to a percentage: 0.5277×100%=52.77%
Rounded to the nearest whole percent, this is 53%, making C correct.
Now for the wrong answers: A) 40% is too low and might come from incorrectly calculating the decay factor or confusing this with a different depreciation rate. B) 60% is close but represents rounding 52.77% up too generously, or possibly miscalculating one of the multiplication steps. D) 35% is significantly too low and likely results from a major calculation error, perhaps confusing the retention rate with the loss rate.
Strategy tip: For exponential decay problems, remember that if something decreases by x%, you multiply by (100-x)% each period. Don't subtract 12% five times to get 60% - that's linear thinking, not exponential. Always raise the retention factor to the power of the number of time periods. Question 4
A plant is 12 cm tall when measured on day 0. It grows at a constant rate of 1.5 cm per day. Which equation gives the plant's height h (cm) after d days?
- h=12(1.5)d
- h=1.5d+12 (correct answer)
- h=12d+1.5
- h=12−1.5d
Explanation: The question asks which equation gives the plant's height h after d days, growing at a constant rate. This is a linear model with constant additive growth of 1.5 cm per day, not exponential. Starting at 12 cm, h=12 + 1.5d fits. Build the model by adding the daily increase to the initial height. A key error is using exponential like (1.5)^d for additive scenarios. Check for constant differences to confirm linear growth.
Question 5
A company's number of customers is modeled by C(t)=1500(1.15)t, where t is in years. Which is the best interpretation of 1.15?
- Adds 1.15 customers per year
- 15% growth each year (correct answer)
- Initial customers are 1.15
- 15 customers added each year
Explanation: The question requires interpreting the 1.15 in the exponential model C(t) = 1500(1.15)^t for customer growth. This is an exponential model, showing multiplicative growth by 1.15 each year, contrasting with linear additive increases. The 1.15 represents a 15% annual growth rate, as 1 + 0.15 = 1.15. Key errors include mistaking it for additive, like adding 1.15 or 15 customers yearly. Another mistake is confusing the initial value with the growth factor. When analyzing exponential models, identify the base as the multiplicative factor and convert to percentage for interpretation.
Question 6
A full fuel tank holds 50 liters. If the volume decreases by 7% each minute, which function gives the number of liters V(t) remaining t minutes after the leak begins?
- V(t)=50−7t
- V(t)=50−0.07t
- V(t)=50(0.07)t
- V(t)=50(0.93)t (correct answer)
Explanation: When you see a problem about percentage decreases over time, you're dealing with exponential decay. The key insight is that each minute, the tank retains a certain percentage of what was there the previous minute.
If the volume decreases by 7% each minute, then 93% remains after each minute passes. This means you multiply the previous amount by 0.93 repeatedly. Starting with 50 liters, after 1 minute you have 50×0.93, after 2 minutes you have 50×0.93×0.93=50×(0.93)2, and after t minutes you have 50×(0.93)t. This confirms that choice D is correct.
Choice A assumes a linear decrease of 7 liters per minute, but 7% of a changing amount isn't constant—it gets smaller as the tank empties. Choice B makes the same linear mistake but converts the percentage correctly to 0.07. However, this would mean losing exactly 0.07 liters per minute regardless of how much fuel remains. Choice C uses the right exponential structure but the wrong base—it represents keeping only 7% each minute (losing 93%), which would empty the tank impossibly fast.
The trap here is confusing linear decrease (subtracting the same amount each time) with exponential decay (multiplying by the same factor each time). Remember: percentage changes over time always create exponential functions, and "decreasing by x%" means multiplying by (1−x%) each period. Question 7
A town's water usage is modeled by W(t)=12000(1.03)t, where t is years since 2020 and W is in gallons per day. What is the annual percent increase in water usage according to the model?
- 0.03%
- 3% (correct answer)
- 30%
- 103%
Explanation: The question asks for the annual percent increase in water usage from W(t)=12000(1.03)^t. This is exponential growth with multiplicative factor 1.03 per year. The 1.03 means 3% increase annually. Emphasize multiplicative over additive. A common error is misreading as 0.03% or adding 103%. Identify the base minus 1 for percent in exponential models.
Question 8
A water tank is being filled at a constant rate. A graph of volume V (in gallons) versus time t (in minutes) is shown as a straight line passing through (0,15) and (6,39). Which equation models the relationship between V and t?
- V=4t+15 (correct answer)
- V=6t+15
- V=15(4)t
- V=15(1.4)t
Explanation: The question asks for the equation modeling the linear relationship between volume V and time t for a tank filled at a constant rate. The straight-line graph indicates a linear model with constant additive changes in volume per minute. The slope is calculated as (39 - 15) / (6 - 0) = 4 gallons per minute, and the y-intercept is 15, yielding V = 4t + 15. This emphasizes additive growth, unlike exponential which would show multiplicative changes. A key error is confusing the points and selecting an exponential form like V = 15(1.4)^t, which doesn't fit the straight line. For graph-based questions, calculate the slope using two points to verify linear models and avoid assuming exponential without checking ratios.
Question 9
A linear model for the number of tickets sold is T(h)=95h+240, where h is hours since sales opened. How many tickets are predicted to be sold after 6 hours?
- 570
- 810 (correct answer)
- 900
- 1,110
Explanation: The question asks for the predicted number of tickets sold after 6 hours using the linear model T(h) = 95h + 240. This is a linear model, characterized by constant additive increases of 95 tickets per hour, in contrast to exponential models where changes are multiplicative. Calculate by substituting h = 6: 95 × 6 = 570, plus 240 equals 810 tickets. Common errors include omitting the +240 to get 570 or adding incorrectly to reach 900 or 1110. Remember, linear growth adds a fixed amount each time, not a percentage. For test-taking, double-check substitutions in linear equations to ensure all terms are accounted for.
Question 10
Two savings plans start with the same $2{,}000 deposit.
• Plan F grows linearly: F(t)=2,000+150t.
• Plan G grows exponentially: G(t)=2,000(1.04)t.
For approximately how many years will the two balances be equal?
- about 25 years
- about 28 years
- about 31 years (correct answer)
- They will never be equal.
Explanation: When you encounter problems comparing linear and exponential functions, you're looking for intersection points where the two functions have equal values. This requires setting the equations equal and solving for the variable.
To find when the balances are equal, set F(t)=G(t):
2,000+150t=2,000(1.04)t
This equation can't be solved algebraically, so you need to test values or use a graphing approach. Since Plan F grows by a constant $150 per year while Plan G grows by 4% annually, the exponential plan will eventually overtake the linear one.
Testing strategic values:
- At $t=25 : F(25)=5,750 and G(25)≈5,332 $
- At t = 30: F(30) = 6{,}500 and G(30) ≈ 6{,}493
- At t = 31: F(31) = 6{,}650 and G(31) ≈ 6{,}752
The crossover occurs between years 30 and 31, making the answer approximately 31 years.
Choice A (25 years) is too early—the linear function still exceeds the exponential at this point. Choice B (28 years) is also premature; you haven't reached the intersection yet. Choice D (never equal) misunderstands exponential growth—while the exponential function starts slower, it eventually surpasses any linear function.
Study tip: For linear vs. exponential comparisons, remember that exponential functions always eventually overtake linear ones, but it may take longer than you initially expect. Always test values around your estimate to pinpoint the intersection. Question 11
A phone battery has 100% charge at noon and loses 12 percentage points per hour while streaming video. Let t be hours after noon and B be battery percent. Which equation models this situation, and what is the predicted battery percent at t=5?
- B=100(0.88)t; 52%
- B=100−12t; 40% (correct answer)
- B=12t−100; 40%
- B=100−5t; 75%
Explanation: The question models phone battery percent B losing 12 points per hour after 100% at noon, and predicts at t=5. This is linear decay with constant subtraction of 12 per hour, emphasizing additive change over multiplicative. The equation is B=100-12t; at t=5, B=100-60=40%. Verify: at t=1, 88%; t=2, 76%, linear. Errors include exponential decay (A) or positive slope (C). Distinguish: constant differences mean linear, ratios mean exponential.
Question 12
A store's daily revenue follows R(d)=800(1.02)d, where d is days after a marketing campaign begins. What does the 1.02 represent in context?
- $1.02 added each day
- 2% increase per day (correct answer)
- $800 increase per day
- 2-day doubling time
Explanation: The question asks what 1.02 represents in the exponential revenue model R(d)=800(1.02)^d. The model is exponential growth because 1.02 is a constant multiplicative factor greater than 1, unlike linear's additive increases. The 1.02 means revenue multiplies by 1.02 daily, or grows 2% per day. This is calculated as growth rate = factor - 1 = 0.02. A key error is interpreting it as additive $1.02 daily. In exponential models, subtract 1 from the base to find the percentage multiplicative change.
Question 13
Two hoses are attached to identical empty containers.
• Hose L adds water according to L(t)=5+2t, where t is the time in minutes and L(t) is in liters.
• Hose E adds water according to E(t)=5(1.3)t.
At what whole–number minute does the amount of water from hose E first exceed the amount from hose L?
- 3 minutes
- 4 minutes (correct answer)
- 5 minutes
- 6 minutes
Explanation: When you encounter problems comparing linear and exponential functions, you need to find where one function overtakes another by testing values systematically.
Here you have a linear function L(t)=5+2t versus an exponential function E(t)=5(1.3)t. The linear function grows at a constant rate of 2 liters per minute, while the exponential function starts slower but accelerates over time.
Let's calculate both functions at each answer choice:
At t=3: L(3)=5+2(3)=11 liters, E(3)=5(1.3)3=5(2.197)≈11.0 liters
At t=4: L(4)=5+2(4)=13 liters, E(4)=5(1.3)4=5(2.856)≈14.3 liters
At 4 minutes, hose E finally produces more water than hose L for the first time.
Choice A (3 minutes) is incorrect because at t=3, both functions produce approximately the same amount—hose E hasn't exceeded hose L yet. Choice C (5 minutes) and D (6 minutes) are wrong because while hose E does exceed hose L at these times, the question asks for the first time this happens, which occurs earlier at 4 minutes.
The key strategy here is recognizing that exponential functions eventually outpace linear functions, but you need to test values methodically to find the exact crossover point. Always check the time period just before your suspected answer to confirm it's truly the "first" occurrence. Question 14
A new app had 800 downloads on day 0.
• Plan A: The total number of downloads increases by 60 each day.
• Plan B: The total number of downloads increases by 9% each day.
After 20 days, which statement about the total downloads is true?
- Plan A will have about 1{,}500 more downloads than Plan B.
- Plan A will have about 400 more downloads than Plan B.
- Both plans will result in about the same number of downloads.
- Plan B will have about 2{,}500 more downloads than Plan A. (correct answer)
Explanation: When you encounter problems comparing different growth patterns, you need to distinguish between linear growth (constant amount added) and exponential growth (constant percentage increase). This distinction becomes crucial over longer time periods.
For Plan A (linear growth), the app gains exactly 60 downloads each day. After 20 days: 800+(60×20)=800+1,200=2,000 total downloads.
For Plan B (exponential growth), the total downloads multiply by 1.09 each day. After 20 days: 800×(1.09)20. Since (1.09)20≈5.604, this gives us 800×5.604=4,483 total downloads.
Plan B exceeds Plan A by 4,483−2,000=2,483 downloads, which is about 2,500 more downloads.
Choice A incorrectly suggests Plan A has more downloads and uses an unrealistic difference. Choice B also wrongly favors Plan A with a much smaller gap that doesn't reflect exponential growth over 20 days. Choice C assumes the plans yield similar results, but exponential growth significantly outpaces linear growth over this timeframe. Choice D correctly identifies that Plan B generates about 2,500 more downloads than Plan A.
Strategy tip: When comparing linear versus exponential growth over multiple time periods, exponential growth typically dominates after sufficient time, even when it starts slower. Always calculate both scenarios completely rather than estimating—the exponential function (1.09)20 creates a much larger multiplier than intuition suggests. Question 15
A town had 12,500 residents at the beginning of 2010 and has been gaining about 450 residents each year since then. Which equation best models the population P (in residents) t years after the start of 2010?
- P=12,500+4.5t
- P=12,500(1+4.5t)
- P=12,500(1.045)t
- P=12,500+450t (correct answer)
Explanation: When you encounter word problems about population growth, the key is identifying whether the growth is linear (constant amount added each period) or exponential (constant percentage increase each period). The phrase "gaining about 450 residents each year" signals linear growth.
For linear growth, you need a base amount plus a constant rate times time. Here, the town starts with 12,500 residents and adds 450 residents per year. After t years, the population will be the initial population plus 450 times the number of years that have passed. This gives us P=12,500+450t, which matches choice D.
Choice A incorrectly uses 4.5 instead of 450 for the yearly increase. This represents a common decimal placement error—perhaps confusing 450 residents with 4.5 hundred residents, but the problem clearly states 450.
Choice B uses the form for exponential growth but with the wrong structure. The expression 12,500(1+4.5t) would mean the population is multiplied by (1+4.5t) each year, which isn't what's happening here.
Choice C shows exponential growth with the correct initial value but assumes a 4.5% annual growth rate. Exponential models use the form P=P0(1+r)t where r is the growth rate as a decimal. However, the problem describes adding a fixed number of residents, not a percentage increase.
Remember: "adds/gains a fixed amount" means linear growth (addition), while "grows by a percentage" means exponential growth (multiplication with exponents). Question 16
A coordinate plane shows points from a situation: (0,100), (1,110), (2,121), (3,133.1). Which equation best models the data?
- y=10x+100
- y=100(1.1)x (correct answer)
- y=100(0.9)x
- y=100+1.1x
Explanation: The question asks for the equation best modeling points (0,100), (1,110), (2,121), (3,133.1). The model is exponential because ratios are constant at 1.1, showing multiplicative growth of 10% per unit, unlike linear constant differences. The equation y=100(1.1)^x fits: at x=1, 100×1.1=110; x=2, 110×1.1=121; x=3, 121×1.1=133.1. Differences increase (10,11,12.1), confirming not linear. A key error is choosing linear like 100+10x, ignoring accelerating change. Plot or check ratios for points to identify multiplicative exponential patterns over additive linear.
Question 17
A line of best fit for a scatter plot is given by y=1.8x+12. In context, x is hours worked and y is dollars earned. What does the 12 represent?
- Hourly wage
- Starting amount earned at 0 hours (correct answer)
- Percent increase per hour
- Hours needed to earn $12
Explanation: The question asks what the 12 represents in the linear model y=1.8x +12 for earnings. The model is linear because earnings increase additively by $1.80 per hour, unlike exponential percentage growth. The 12 is the y-intercept, meaning $12 earned at 0 hours, perhaps a base pay. Substituting x=0 gives y=12 directly. A common error is thinking it's the hourly wage, which is the slope. In linear fits, interpret intercept as the additive starting value when input is zero.
Question 18
A bacteria culture starts with 200 bacteria and doubles every 3 hours. The model is B(t)=200(2)t/3, where t is time in hours. What does the 200 represent in this context?
- Bacteria added each hour
- Initial bacteria at t=0 (correct answer)
- Doubling time in hours
- Growth factor per hour
Explanation: The question asks what the number 200 represents in the exponential model B(t)=200(2)t/3 for bacteria growth. The model is exponential, with multiplicative doubling every 3 hours, not linear additive changes. Substituting t=0 gives B(0)=200∗1=200, showing it as the initial number of bacteria. The exponent t/3 adjusts for the tripling period, emphasizing the growth factor. A common error is misinterpreting 200 as the growth factor or added amount, confusing exponential multiplication with linear addition. When interpreting models, evaluate at t=0 to identify initial values and distinguish additive from multiplicative parameters. Question 19
A student writes y=200(1.06)t to model a quantity that starts at 200 and increases by 6 each day. Which is the best critique of the student's model?
- Correct; 6 means 6% growth
- Incorrect; should be y=200+6t (correct answer)
- Incorrect; should be y=200(6)t
- Correct; exponential always fits
Explanation: The question requires critiquing a student's exponential model y=200(1.06)^t for a quantity starting at 200 and increasing by 6 each day. The situation describes linear growth with constant additive increases of 6, not multiplicative exponential change. The correct model is y=200 + 6t, so the student's use of 1.06 (implying 6% growth) is incorrect. A key error is confusing fixed amount increases with percentage increases. Another mistake might be thinking exponential always fits growth. Distinguish by checking if changes are additive (linear) or proportional (exponential), and choose models accordingly.
Question 20
A streaming service has 2,000 users and gains 300 users each month. Another service has 2,000 users and grows by 12% each month. After 6 months, which service will have more users, and why?
- 300/month; constant ratio
- 12%; exponential growth (correct answer)
- 300/month; exponential growth
- 12%; constant difference
Explanation: The question asks which service will have more users after 6 months and why. The first is linear with additive 300/month, the second exponential with multiplicative 12% growth. Calculate linear: 2000 + 3006=3800; exponential: 2000(1.12)^6 ≈3946, so exponential has more due to compounding. This highlights exponential multiplicative advantage over linear additive. A key error is swapping model types. Compare final values after identifying growth types.