What this quiz covers
This quiz focuses on Evaluating Trends And Making Predictions, giving you a quick way to practice the rules, question types, and explanations that matter most for ACT Science.
PASSAGE IV
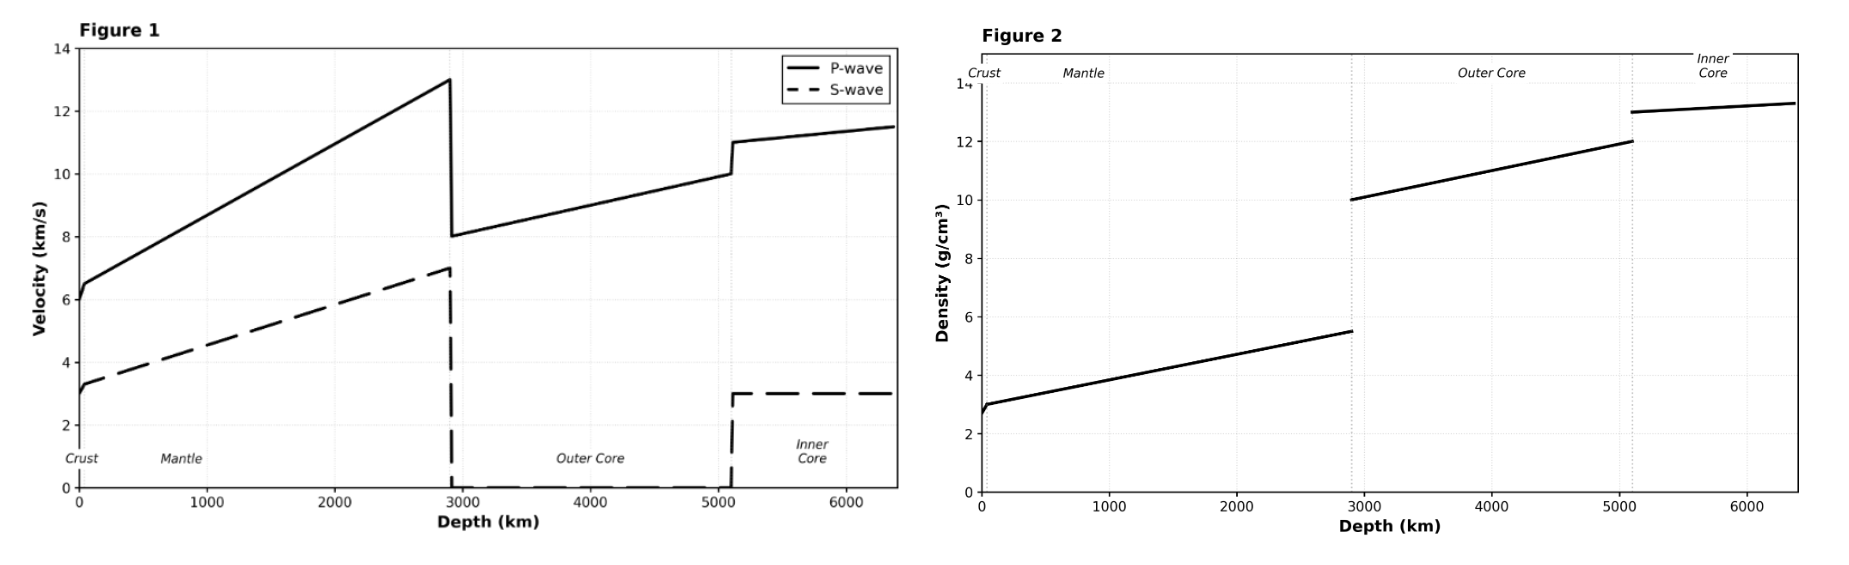
GEOPHYSICS: This passage is adapted from a study on the structure of Earth's interior using seismic waves.
Seismologists study the interior of the Earth by analyzing the propagation of seismic waves generated by earthquakes. There are two main types of body waves:
•P-waves (Primary waves): Compressional waves that travel through solids, liquids, and gases.
•S-waves (Secondary waves): Shear waves that travel only through solids.
The velocity of these waves depends on the density and physical state (solid or liquid) of the material they travel through. Abrupt changes in velocity indicate boundaries between Earth's layers.
Which of the following statements best describes the relationship between depth and density within the Mantle (0-2,900 km), according to Figure 2?
ACT Science Quiz
Practice Evaluating Trends And Making Predictions in ACT Science with focused quiz questions that help you check what you know, review explanations, and build confidence with test-style prompts.
This quiz focuses on Evaluating Trends And Making Predictions, giving you a quick way to practice the rules, question types, and explanations that matter most for ACT Science.
Try each quiz question before looking at the correct answer. Use the explanations to review missed ideas, then come back to similar questions until the pattern feels familiar.
PASSAGE IV
GEOPHYSICS: This passage is adapted from a study on the structure of Earth's interior using seismic waves.
Seismologists study the interior of the Earth by analyzing the propagation of seismic waves generated by earthquakes. There are two main types of body waves:
•P-waves (Primary waves): Compressional waves that travel through solids, liquids, and gases.
•S-waves (Secondary waves): Shear waves that travel only through solids.
The velocity of these waves depends on the density and physical state (solid or liquid) of the material they travel through. Abrupt changes in velocity indicate boundaries between Earth's layers.
Which of the following statements best describes the relationship between depth and density within the Mantle (0-2,900 km), according to Figure 2?
PASSAGE V
BIOLOGY: This passage is adapted from a study on the metabolic rates of vertebrates. Introduction
Metabolism is the set of chemical reactions that occur in living organisms to maintain life. The metabolic rate is often measured by the amount of oxygen (O2) consumed per gram of body mass per hour.
Animals can be classified based on how they regulate body temperature:
•Endotherms (e.g., mammals, birds) generate their own body heat to maintain a constant internal temperature.
•Ectotherms (e.g., reptiles, amphibians) rely on external heat sources to regulate their body temperature.
Students conducted two studies to compare the metabolic rates of a Mouse (Endotherm) and a Lizard (Ectotherm) of similar body mass.
Study 1
The students placed the mouse and the lizard in separate metabolic chambers. They varied the environmental temperature from 5°C to 35°C in 10°C increments. The animals were kept at rest. The rate of oxygen consumption (mL O2/g⋅hr) was measured after the animals had acclimated to each temperature for 30 minutes. Findings were reported in Figure 1.
Study 2
The students investigated the effect of activity level on metabolic rate. They maintained the environmental temperature at 25°C for both animals. They measured the oxygen consumption while the animals were at rest and while they were running on a treadmill at 1.0 km/hr. Findings were reported in Table 1.
Study 3
To determine if body mass affects metabolic rate within the same group, students measured the resting metabolic rate of three different lizards at 25°C. Findings were reported in Table 2.
Consider the data for the Mouse at 35°C in Figure 1. If the temperature were increased further to 45°C, which of the following predictions is most biologically likely?
A materials scientist measured the thickness of a coating after each pass of a sprayer. Based on the pattern in the table, what thickness would most likely be measured after 6 passes?
An engineer recorded the distance a test cart traveled after different numbers of identical pushes on a smooth track. Based on the pattern in the table, what distance would most likely be traveled after 6 pushes?
PASSAGE II
BIOLOGY: This passage is adapted from a study on the factors affecting the rate of photosynthesis in aquatic plants.
Introduction
Photosynthesis is the process by which green plants use sunlight to synthesize nutrients from carbon dioxide (CO2) and water (H2O). The process releases oxygen (O2) as a byproduct according to the following chemical equation: 6CO2+6H2O+light energy→C6H12O6+6O2 Students conducted three studies to investigate how different environmental factors affect the rate of photosynthesis in Elodea, an aquatic plant. The rate was measured by counting the number of oxygen bubbles produced by a cut stem of Elodea submerged in water over a 5-minute period.
Study 1
To test the effect of light intensity, students placed a 10 cm sprig of Elodea into a test tube filled with a 0.5% sodium bicarbonate (NaHCO3) solution (a source of CO2). A light source was placed at various distances from the test tube. The temperature was maintained at 25°C. The number of bubbles produced in 5 minutes was recorded.
Study 2
To test the effect of light color (wavelength), students used the same setup as in Study 1. The light source was kept at a constant distance of 10 cm. Colored filters were placed between the light and the plant to isolate specific wavelengths. Clear cellophane was used as a control.
Study 3
To test the effect of CO2 availability, students prepared five test tubes with different concentrations of sodium bicarbonate (NaHCO3). A 10 cm sprig of Elodea was placed in each. The light source was kept constant at 10 cm (white light).
Based on Table 1, as the distance of the light source from the plant increases, the rate of photosynthesis:
PASSAGE V
BIOLOGY: This passage is adapted from a study on the metabolic rates of vertebrates. Introduction
Metabolism is the set of chemical reactions that occur in living organisms to maintain life. The metabolic rate is often measured by the amount of oxygen (O2) consumed per gram of body mass per hour.
Animals can be classified based on how they regulate body temperature:
•Endotherms (e.g., mammals, birds) generate their own body heat to maintain a constant internal temperature.
•Ectotherms (e.g., reptiles, amphibians) rely on external heat sources to regulate their body temperature.
Students conducted two studies to compare the metabolic rates of a Mouse (Endotherm) and a Lizard (Ectotherm) of similar body mass.
Study 1
The students placed the mouse and the lizard in separate metabolic chambers. They varied the environmental temperature from 5°C to 35°C in 10°C increments. The animals were kept at rest. The rate of oxygen consumption (mL O2/g⋅hr) was measured after the animals had acclimated to each temperature for 30 minutes. Findings were reported in Figure 1.
Study 2
The students investigated the effect of activity level on metabolic rate. They maintained the environmental temperature at 25°C for both animals. They measured the oxygen consumption while the animals were at rest and while they were running on a treadmill at 1.0 km/hr. Findings were reported in Table 1.
Study 3
To determine if body mass affects metabolic rate within the same group, students measured the resting metabolic rate of three different lizards at 25°C. Findings were reported in Table 2.
Based on Table 2, what is the relationship between body mass and metabolic rate per gram for lizards?
PASSAGE II
BIOLOGY: Research Summary
Introduction
Transpiration is the process by which moisture is carried through plants from roots to small pores on the underside of leaves, where it changes to vapor and is released to the atmosphere. A botanist conducted two studies to investigate how environmental factors affect the transpiration rate of Spathiphyllum (peace lily) plants.
Study 1
The botanist placed 5 identical Spathiphyllum plants into 5 identical environmentally controlled chambers. The relative humidity inside all chambers was kept constant at 40%, and the temperature was kept constant at 22°C. The botanist varied the light intensity—measured in micromoles of photons per square meter per second (μmol/m2/s)—in each chamber. After 4 hours, the botanist measured the mass of water lost by each plant to calculate the transpiration rate in milligrams of water per square centimeter of leaf area per hour (mg/cm2/hr). Results are shown in Table 1.
Study 2
The botanist obtained 5 new, identical Spathiphyllum plants and placed them in the chambers. This time, the light intensity in all chambers was kept constant at 400 μmol/m2/s and the temperature at 22°C. The botanist varied the relative humidity in each chamber. The transpiration rates were calculated after 4 hours. Results are shown in Table 2.
Suppose the botanist conducted a third study where a Spathiphyllum plant was exposed to a relative humidity of 50% and a light intensity of 400 μmol/m²/s. Based on Table 2, the transpiration rate for this plant would most likely be:
PASSAGE I
EARTH SCIENCE: Data Representation
Earth's atmosphere is divided into distinct layers based on how temperature changes with altitude. The boundary between each layer is called a pause (e.g., the tropopause separates the troposphere from the stratosphere). Figure 1 shows how average atmospheric temperature varies with altitude. Table 1 shows how average atmospheric pressure, measured in atmospheres (atm), changes with altitude.
A weather balloon is launched from sea level and ascends to an altitude of 25 km. Based on the provided data, during the balloon's flight, the atmospheric pressure it experiences will most likely:
A hospital measured the activity of a radioactive tracer every 3 days after it was prepared. Table 1 shows the measurements.
If the pattern in Table 1 continues, what will the activity be 15 days after the tracer was prepared?
The power output of a rooftop solar array was recorded every 2 hours on a clear day. Sunset that day was shortly after 18:00. Figure 1 shows the results.
Based on Figure 1, what will the output be closest to at 18:00?
A sealed rigid flask of gas was warmed in stages and its pressure was recorded at four temperatures. The flask did not leak. Figure 1 shows the results.
Based on Figure 1, what pressure would the sample reach at 400 K?
A seed crystal was suspended in a saturated solution that was kept saturated throughout, and the crystal was weighed every 2 days. Table 1 shows the results.
Based on Table 1, what would the crystal have weighed on day 5?
A tide gauge recorded the clock time of four consecutive high tides at one harbour. Table 1 shows the times; the third and fourth tides occurred on the day after the first and second.
Based on the pattern in Table 1, at about what time will the next high tide occur?
Fish of one species were placed one at a time in a swim tunnel and the fastest speed each could hold for 20 minutes was recorded. Five water temperatures were tested, with the same oxygen level in every trial. Figure 1 shows the mean result at each temperature.
Based on Figure 1, what would the sustained swimming speed most likely be at 35 °C?
A rechargeable battery was charged and discharged repeatedly, and its capacity was measured every 200 cycles as a percentage of its capacity when new. The manufacturer replaces a battery once its capacity falls to 80%. Table 1 shows the measurements.
Based on Table 1, after about how many cycles will the battery reach the 80% replacement point?
Divers surveyed reef sites during four summers and recorded the percentage of coral colonies that had bleached, along with how far the sea surface temperature exceeded its long-term average. Figure 1 shows the results. No more than 100% of the colonies at a site can bleach.
If the pattern in Figure 1 continues, what percentage of colonies would be expected to bleach at an anomaly of 2.5 °C?
A monitoring station recorded the atmospheric CO₂ concentration each May and each September for three years. Concentrations are always higher in May than in the following September because plants take up CO₂ over the northern summer. Figure 1 shows the readings.
Based on Figure 1, what reading is expected in May 2025?
A reservoir was measured on the first day of each month during a drought. Water cannot be drawn from it once the level falls below 22.0 m. Table 1 shows the readings.
If the level keeps falling at the same rate, on the first day of which month will the recorded level first be below 22.0 m?
A ball was dropped onto a hard floor and the height it reached after each bounce was measured. Table 1 shows the first four bounces.
Based on the pattern in Table 1, what height will the ball reach after the fifth bounce?
A light trap was run on the same schedule in every season for two years, and the mean number of moths caught per night was recorded. Figure 1 shows the counts.
Based on Figure 1, what is the most reasonable prediction for spring 2025?