ACT Science Quiz: Comparing Data Sets
20 questions · exam conditions
0:00
Comparing Data SetsQuestion 1 of 20

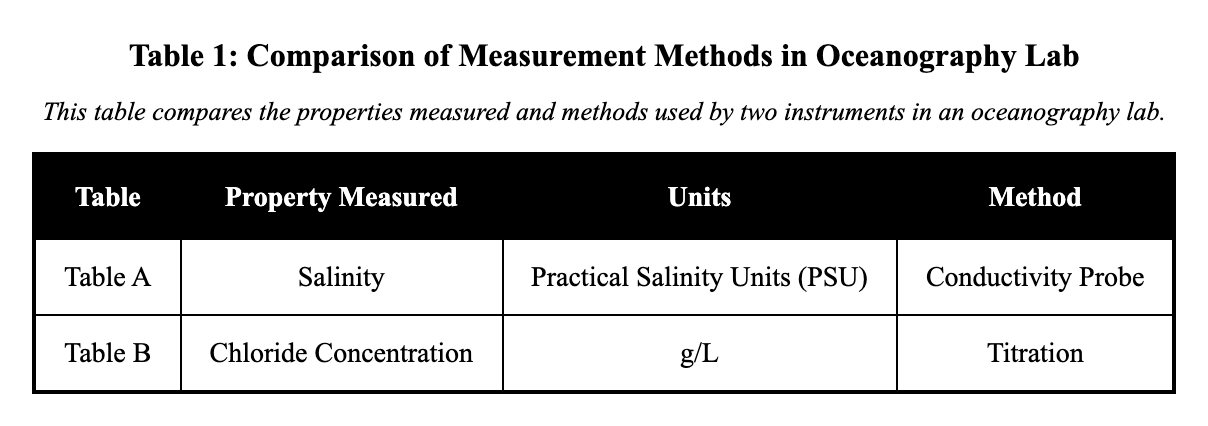
An oceanography lab compared salinity measurements from two instruments. Table A shows salinity measured in practical salinity units (PSU) using a conductivity probe. Table B shows chloride concentration measured in g/L using a titration method at the same depths. Identify the primary difference in what is being measured and how.
Question graphic
Both tables measure chloride, but Table A reports daily averages and Table B reports hourly spikes.
Table A measures chloride (g/L) by titration, while Table B measures salinity (PSU) with a conductivity probe.
Both tables measure salinity in PSU, but Table B uses a different depth scale in centimeters.
Table A measures salinity (PSU) with a conductivity probe, while Table B measures chloride (g/L) by titration at the same depths.
← Back to quizzes

ACT Science Quiz

ACT Science Quiz: Comparing Data Sets

Practice Comparing Data Sets in ACT Science with focused quiz questions that help you check what you know, review explanations, and build confidence with test-style prompts.

What this quiz covers

This quiz focuses on Comparing Data Sets, giving you a quick way to practice the rules, question types, and explanations that matter most for ACT Science.

How to use this quiz

Try each quiz question before looking at the correct answer. Use the explanations to review missed ideas, then come back to similar questions until the pattern feels familiar.

All questions

Question 1

An oceanography lab compared salinity measurements from two instruments. Table A shows salinity measured in practical salinity units (PSU) using a conductivity probe. Table B shows chloride concentration measured in g/L using a titration method at the same depths. Identify the primary difference in what is being measured and how.

  1. Both tables measure chloride, but Table A reports daily averages and Table B reports hourly spikes.
  2. Table A measures chloride (g/L) by titration, while Table B measures salinity (PSU) with a conductivity probe.
  3. Both tables measure salinity in PSU, but Table B uses a different depth scale in centimeters.
  4. Table A measures salinity (PSU) with a conductivity probe, while Table B measures chloride (g/L) by titration at the same depths. (correct answer)
Explanation: The main difference lies in the specific property measured and the method used, even at the same depths. Table A reports salinity in practical salinity units (PSU) using a conductivity probe during a cast; Table B reports chloride concentration in g/L using lab titration of samples. This distinction matters because salinity estimates total salts via conductivity, while chloride measures one component chemically, affecting how data are interpreted for ocean properties. A distractor could swap the methods or variables, but the captions specify conductivity for salinity in A and titration for chloride in B.

Question 2

PASSAGE II

Reaction Rates

Introduction

The rate of a chemical reaction is defined as the speed at which reactants are consumed or products are formed. Students conducted three studies to investigate the factors affecting the rate of the reaction between magnesium ribbon (Mg) and hydrochloric acid (HCl). The reaction produces magnesium chloride (MgCl₂) and hydrogen gas (H₂):

Mg(s)+2HCl(aq)MgCl2(aq)+H2(g)Mg(s) + 2HCl(aq) \rightarrow MgCl_2(aq) + H_2(g)

In each trial, the students placed a specific mass of Mg into a flask containing excess HCl. They measured the time required to collect 50 mL of H₂ gas.

Study 1

In Trials 1–3, the students varied the concentration of the HCl solution while keeping the temperature constant at 20°C. In each trial, a 0.5 g strip of Mg ribbon was used. The results are shown in Table 1.

Study 2

In Trials 4–6, the students varied the temperature of the HCl solution while keeping the concentration constant at 1.0 M. In each trial, a 0.5 g strip of Mg ribbon was used. The results are shown in Table 2.

Study 3

The students investigated the effect of surface area on reaction rate. They performed two trials using 1.0 M HCl at 20°C.

  • Trial 7: Used a 0.5 g strip of Mg ribbon (Low Surface Area).
  • Trial 8: Used 0.5 g of Mg powder (High Surface Area).

In both trials, the total mass of Mg was kept constant at 0.5 g to ensure the same theoretical yield of gas. They measured the volume of gas produced over time. The results are shown in Figure 1.

Compare the results of Trial 2 and Trial 5. Which set of conditions resulted in a faster reaction rate?

  1. Trial 5, because the concentration was lower than in Trial 2.
  2. Trial 2, because the reaction temperature was lower.
  3. Trial 5, because the temperature was higher than in Trial 2.
  4. Trial 2, because it took 40 seconds to collect the gas, whereas Trial 5 took 42 seconds. (correct answer)
Explanation: Reaction rate and time are inversely related here: since every trial collects the same 50 mL of H2, the trial that needs less time has the faster rate. Trial 2 used 2.0 M HCl at 20 degrees Celsius and took 40 s, while Trial 5 used 1.0 M HCl at 35 degrees Celsius and took 42 s, so Trial 2 was faster because 40 s is less than 42 s — that timing comparison is the whole justification. The tempting mistake is reasoning that Trial 5 must be faster because its temperature was higher; raising temperature does speed reactions up in general, but Trial 2 also has double the concentration, and the recorded times settle the question. Saying Trial 5 was faster because its concentration was lower gets the chemistry backwards, since lower concentration slows the reaction. And claiming Trial 2 was faster because its temperature was lower attaches a correct conclusion to a reason that contradicts the data, where 20 degrees Celsius took the longest at 85 s. Always check the measured times before reasoning from which variable should win.

Question 3

PASSAGE II

BIOLOGY: Research Summary

Introduction

Transpiration is the process by which moisture is carried through plants from roots to small pores on the underside of leaves, where it changes to vapor and is released to the atmosphere. A botanist conducted two studies to investigate how environmental factors affect the transpiration rate of Spathiphyllum (peace lily) plants.

Study 1

The botanist placed 5 identical Spathiphyllum plants into 5 identical environmentally controlled chambers. The relative humidity inside all chambers was kept constant at 40%, and the temperature was kept constant at 22°C. The botanist varied the light intensity—measured in micromoles of photons per square meter per second (μmol/m2/s\mu mol/m^2/s)—in each chamber. After 4 hours, the botanist measured the mass of water lost by each plant to calculate the transpiration rate in milligrams of water per square centimeter of leaf area per hour (mg/cm2/hrmg/cm^2/hr). Results are shown in Table 1.

Study 2

The botanist obtained 5 new, identical Spathiphyllum plants and placed them in the chambers. This time, the light intensity in all chambers was kept constant at 400 μmol/m2/s\mu mol/m^2/s and the temperature at 22°C. The botanist varied the relative humidity in each chamber. The transpiration rates were calculated after 4 hours. Results are shown in Table 2.

Consider the plant in Chamber 3 and the plant in Chamber 7. Which of the following statements about these two plants is most accurate?

  1. The plant in Chamber 3 experienced a higher temperature than the plant in Chamber 7.
  2. The plant in Chamber 7 was exposed to a higher light intensity than the plant in Chamber 3.
  3. Both plants were exposed to the same environmental conditions (40% humidity and 400 μmol/m²/s light) and had the same transpiration rate of 4.8 mg/cm²/hr. (correct answer)
  4. The plant in Chamber 3 had a transpiration rate of 6.5, while the plant in Chamber 7 had a transpiration rate of 4.8.
Explanation: The correct answer is C. Chamber 3 was in Study 1: light intensity was varied, humidity was constant at 40%, and Chamber 3 received 400 μmol/m²/s light, producing a transpiration rate of 4.8. Chamber 7 was in Study 2: humidity was varied, light intensity was constant at 400 μmol/m²/s, and Chamber 7 had 40% humidity, also producing 4.8. Both plants were therefore exposed to identical conditions (400 light, 40% humidity) and produced identical transpiration rates. A is wrong — temperature was held constant at 22°C in both studies. B is wrong — both chambers received 400 μmol/m²/s. D is wrong — 6.5 corresponds to Chamber 6 (20% humidity), not Chamber 3. Pro tip: Cross-study comparison questions require identifying the controlled variables in each study and checking whether they match the comparison point.

Question 4

Two enzymes were tested at five pH values. A sample of each enzyme was held at 37 °C for 10 minutes at each pH, and its activity was measured in units. Figure 1 shows the results.

Based on Figure 1, the difference between the activity of Enzyme A and the activity of Enzyme B is greatest at which pH?

  1. pH 2
  2. pH 4
  3. pH 6 (correct answer)
  4. pH 8
Explanation: Reading the paired bars in Figure 1: at pH 2 the difference is 60 − 4 = 56 units; at pH 4 it is 44 − 18 = 26 units; at pH 6 it is 80 − 10 = 70 units; at pH 8 it is 58 − 6 = 52 units. The largest gap, 70 units, occurs at pH 6.

Question 5

In two studies, the solubility of a different compound was measured at six temperatures. In each study the compound was added to 100 mL of water until no more would dissolve. Figure 1 shows both sets of results.

Based on Figure 1, the solubility of Compound Y first becomes greater than the solubility of Compound X between which two temperatures?

  1. 10 °C and 20 °C
  2. 20 °C and 30 °C
  3. 30 °C and 40 °C
  4. 40 °C and 50 °C (correct answer)
Explanation: At 40 °C, Compound Y (27 g/100 mL) is still below Compound X (32 g/100 mL). At 50 °C, Compound Y (40 g/100 mL) is above Compound X (36 g/100 mL). The curves therefore cross between 40 °C and 50 °C. Compound Y is lower at every temperature at or below 40 °C and already higher once 50 °C is reached.

Question 6

Two groups of mice of the same starting mass were fed different diets for 8 weeks. The mean body mass of each group was recorded every 2 weeks. Figure 1 shows the results.

According to Figure 1, over the 8 weeks the mass gained on Diet B was approximately how many times the mass gained on Diet A?

  1. 1.5 times
  2. 2.3 times (correct answer)
  3. 3.0 times
  4. 3.8 times
Explanation: Both groups started at 20 g. Over 8 weeks the Diet A group reached 33 g, a gain of 13 g, and the Diet B group reached 50 g, a gain of 30 g. Dividing, 30 ÷ 13 ≈ 2.3. Comparing the final masses instead of the gains would give about 1.5, which is why that option is close but wrong.

Question 7

Two groups of volunteers completed the same exercise test. Heart rate was recorded immediately afterwards and each minute for the next 5 minutes. Figure 1 shows the mean heart rate of each group.

According to Figure 1, the trained group first falls to or below the untrained group's 5-minute heart rate at which time?

  1. 1 min
  2. 2 min (correct answer)
  3. 3 min
  4. 4 min
Explanation: The untrained group's heart rate 5 minutes after exercise is 114 beats per minute. The trained group is at 128 after 1 minute and 108 after 2 minutes, so 2 minutes is the first reading at or below 114. The trained group reaches in 2 minutes what takes the untrained group the full 5 minutes.

Question 8

The annual mass balance of two glaciers was measured for five years. A positive balance means the glacier gained mass over the year and a negative balance means it lost mass. Figure 1 shows the results.

Based on Figure 1, in how many of the five years did both glaciers lose mass?

  1. 2 years
  2. 3 years
  3. 4 years (correct answer)
  4. 5 years
Explanation: Glacier B has a negative balance in all five years. Glacier A is negative in 2018, 2019, 2021, and 2022, but gained mass in 2020 (+0.1 m). Both glaciers therefore lost mass in 4 of the 5 years.

Question 9

Samples of two alloys were prepared at five carbon contents and pulled apart in the same testing machine. The tensile strength of each sample was recorded. Table 1 shows the results.

Based on Table 1, the two alloys are closest in tensile strength at which carbon content?

  1. 0.1%
  2. 0.2% (correct answer)
  3. 0.3%
  4. 0.5%
Explanation: The differences in Table 1 are 40 MPa at 0.1%, 10 MPa at 0.2%, 20 MPa at 0.3%, 50 MPa at 0.4%, and 75 MPa at 0.5%. The smallest difference, 10 MPa, is at 0.2% carbon, where the alloys are closest in strength.

Question 10

A wetland was restored, and the same survey was carried out in the year before the work and the year after it. Figure 1 shows the number of individuals counted in each of four animal groups.

Based on Figure 1, the count of which group increased by the greatest factor after restoration?

  1. Wading birds (correct answer)
  2. Fish
  3. Dragonflies
  4. Frogs
Explanation: Dividing the after count by the before count gives about 2.3 for frogs (28 ÷ 12), 1.4 for dragonflies (55 ÷ 40), 3.7 for wading birds (22 ÷ 6), and 1.1 for fish (20 ÷ 18). Wading birds increased by the largest factor even though frogs and wading birds gained the same number of individuals.

Question 11

Equal volumes of water were added to a clay soil sample and a sandy soil sample of the same size. The percentage of that water still held by each sample was measured over 12 hours. Table 1 shows the results.

Based on Table 1, 8 hours after watering the clay soil retains approximately how many times as much water as the sandy soil?

  1. 1.3 times
  2. 2.1 times (correct answer)
  3. 2.6 times
  4. 3.4 times
Explanation: At 8 hours, Table 1 shows the clay soil holding 78% of the water added and the sandy soil holding 38%. Dividing, 78 ÷ 38 ≈ 2.1. The clay soil holds about twice as much of its water at that time.

Question 12

Two identical bacterial cultures were grown at 37 °C. One received an antibiotic at hour 0 and the other received none. Cell counts were taken every 2 hours. Figure 1 shows the results.

Based on Figure 1, at which time does the treated culture first contain fewer than half as many cells as the untreated culture?

  1. 2 hours
  2. 4 hours
  3. 6 hours (correct answer)
  4. 8 hours
Explanation: Half the untreated count is 15 thousand at 2 hours, 30 thousand at 4 hours, and 70 thousand at 6 hours. The treated culture holds 20, 40, and 55 thousand at those times, so it stays at or above half until 6 hours, where 55 thousand is below 70 thousand for the first time.

Question 13

Two solar panels were mounted side by side and tested at six tilt angles under the same sunlight. Power output was recorded at each angle. Figure 1 shows the results.

Based on Figure 1, the output of Panel A first exceeds the output of Panel B between which two tilt angles?

  1. 0° and 15°
  2. 15° and 30°
  3. 30° and 45° (correct answer)
  4. 45° and 60°
Explanation: At 30°, Panel B produces 305 W against Panel A's 282 W, so B is still ahead. At 45°, Panel A produces 310 W against Panel B's 295 W. The curves cross between 30° and 45°. Panel A is already ahead at 45°, so no later interval can contain the first crossing.

Question 14

The same reaction was run with two catalysts at four temperatures. All other conditions were held constant, and the rate was measured in millimoles of product per minute. Figure 1 shows the results.

Based on Figure 1, the two catalysts give the most nearly equal rates at which temperature?

  1. 20 °C
  2. 30 °C
  3. 40 °C
  4. 50 °C (correct answer)
Explanation: The gap between the two catalysts in Figure 1 is 1.4 mmol per minute at 20 °C, 1.4 at 30 °C, 0.7 at 40 °C, and 0.1 at 50 °C. The rates are closest together at 50 °C, where Catalyst X has caught and overtaken Catalyst Y.

Question 15

Two thermometers were placed in baths held at six reference temperatures measured with a calibrated standard. Table 1 shows the reading of each thermometer at each reference temperature.

Based on Table 1, how do the errors of the two thermometers compare as reference temperature increases?

  1. Thermometer 1's error stays about the same size while Thermometer 2's error grows larger. (correct answer)
  2. Both thermometers' errors grow larger.
  3. Both thermometers' errors stay about the same size.
  4. Thermometer 1's error grows larger while Thermometer 2's error stays about the same size.
Explanation: Thermometer 1 reads 0.2 °C above the reference at every temperature in Table 1, from 0 °C through 100 °C, so its error is constant. Thermometer 2 reads 0.1 °C high at 0 °C but 3.1 °C high at 100 °C, with the error growing steadily in between. Only Thermometer 2's error depends on temperature.

Question 16

Runoff was measured from two watersheds of equal area, one forested and one paved, after five storms of different sizes. Table 1 shows the runoff produced by each watershed.

According to Table 1, how much more runoff did the paved watershed produce than the forested watershed after 30 mm of rainfall?

  1. 15 mm
  2. 17 mm (correct answer)
  3. 23 mm
  4. 32 mm
Explanation: At 30 mm of rainfall, Table 1 gives 23 mm of runoff from the paved watershed and 6 mm from the forested watershed. The difference is 23 − 6 = 17 mm. The other options are values read straight off the table without subtracting: 15 mm and 23 mm and 32 mm are the forested runoff at 50 mm of rainfall and the paved runoff at 30 mm and 40 mm.

Question 17

Two fertilizers were applied to identical test plots at six rates. All plots received the same rainfall and were harvested on the same day. Figure 1 shows the yield from each plot.

Based on Figure 1, the yield with Fertilizer B first exceeds the yield with Fertilizer A between which two application rates?

  1. 0 and 20 kg per hectare
  2. 20 and 40 kg per hectare
  3. 40 and 60 kg per hectare
  4. 60 and 80 kg per hectare (correct answer)
Explanation: At 60 kg per hectare, Fertilizer A yields 4.6 tonnes and Fertilizer B yields 4.2 tonnes, so A is still ahead. At 80 kg per hectare, B yields 5.0 tonnes against A's 4.8 tonnes. The curves cross between those two rates. Fertilizer A's yield levels off after 60 kg per hectare while Fertilizer B's keeps rising.

Question 18

The same car was braked from five speeds on a dry road surface and again on a wet road surface. The distance travelled from the moment the brakes were applied until the car stopped was recorded. Figure 1 shows both sets of results.

According to Figure 1, at 80 km/h the wet-road braking distance is approximately how many times the dry-road braking distance?

  1. 1.7 times (correct answer)
  2. 2.3 times
  3. 3.0 times
  4. 3.8 times
Explanation: At 80 km/h, Figure 1 gives a wet-road distance of 92 m and a dry-road distance of 55 m. Dividing, 92 ÷ 55 ≈ 1.7. The car needs roughly 1.7 times as much distance to stop on the wet surface at that speed.

Question 19

The fraction of light reflected by two paints was measured at seven wavelengths using the same instrument and light source. Figure 1 shows the results.

According to Figure 1, at which wavelength do the two paints reflect the same percentage of light?

  1. 450 nm
  2. 500 nm
  3. 600 nm
  4. 650 nm (correct answer)
Explanation: The two curves in Figure 1 meet at 650 nm, where both paints reflect 84% of the light. Below 650 nm the white paint reflects more, and at 700 nm the beige paint reflects more (86% against 83%), so the curves cross exactly once.

Question 20

One hundred seeds of each of two species were planted at each of four soil moisture levels and kept at 22 °C for 14 days. The number of seeds that germinated was counted. Figure 1 shows the results.

Based on Figure 1, which species' germination changed more between 30% and 40% soil moisture?

  1. Species Q, which changed by 28 seeds (correct answer)
  2. Species P, which changed by 28 seeds
  3. Species P, which changed by 8 seeds
  4. Species Q, which changed by 8 seeds
Explanation: Between 30% and 40% moisture, Species P falls from 78 to 70, a change of 8 seeds, while Species Q falls from 80 to 52, a change of 28 seeds. Species Q changed by the larger amount.